
Master Apache JMeter - From Load Testing to DevOps
Master performance testing with JMeter
Antonio Gomes Rodrigues, Bruno Demion (Milamber), Philippe Mouawad
- 466 pages
- English
- ePUB (adapté aux mobiles)
- Disponible sur iOS et Android
Master Apache JMeter - From Load Testing to DevOps
Master performance testing with JMeter
Antonio Gomes Rodrigues, Bruno Demion (Milamber), Philippe Mouawad
À propos de ce livre
Learn how to get the most out of JMeter, improve the productivity of your apps, and integrate JMeter with your Agile and DevOps processes.Key Features• Gain insights into preparing test environments and selecting the correct use cases to load test• Learn to analyze a load test with Backend Listener, HTML Report Dashboard, and View Results Tree• Explore how to integrate JMeter in the software factoryBook DescriptionLoad tests help identify the maximum number of requests a software system can handle. One popular open source tool for load testing is JMeter. By leveraging the features and capabilities of JMeter, you can perform extensive load testing and fix issues in your application before they become problematic.This book is written by JMeter developers and begins by discussing the whole process, including recording a script, setting it up, and launching it, enabling you to almost immediately start load testing. You'll learn the best practices that you must follow while designing test cases. You'll also explore the different protocols offered by JMeter through various real-world examples. Finally, you'll see how to integrate JMeter into the DevOps approach and create professional reports. You'll discover ways to use the eco-system of JMeter to integrate new protocols, enrich its monitoring, and leverage its power through the use of the cloud.By the end of this book, you'll know all that's needed to perform comprehensive load testing on your applications by using all the best practices and features of JMeter.What you will learn• Explore various JMeter concepts, including Timers scope and Assertions scope• Discover the types of test protocols and load tests that JMeter supports• Design a realistic test scenario using various tips and best practices• Prepare your test environment with injectors and the system under test• Learn and apply good practices when recording a script• Integrate JMeter with Jenkins using MavenWho this book is forThis book contains all the valuable information you need in one place and is a must for everybody who is seriously working with JMeter. It might be a little condensed for absolute beginners, but this book is the best you can find if you already have some performance testing experience and want to get further. In particular, it would be invaluable to developers who want to expand their JMeter knowledge into advanced topics or switch to JMeter from other load testing tools.
Foire aux questions
Informations
Chapter 1
Quick Start with JMeter
Our Process
- Launch JMeter and prepare the recording of our script
- Configure the browser to use the HTTP(S) Test Script Recorder of JMeter
- Record the script
- Customize our script (add assertions, rename transactions, add think time…)
- Validate our script with a single user
- Configure the load test (define the number of users, number of iterations, warm-up duration, and load test duration…)
- Run and analyze the load test
Setup JMeter to Record Our Browsing Session
- Launch JMeter:

Figure 1.1: JMeter
- Use the Templates… feature of JMeter:

Figure 1.2: JMeter Templates… feature
- Choose Recording with Think Time model and click Create:
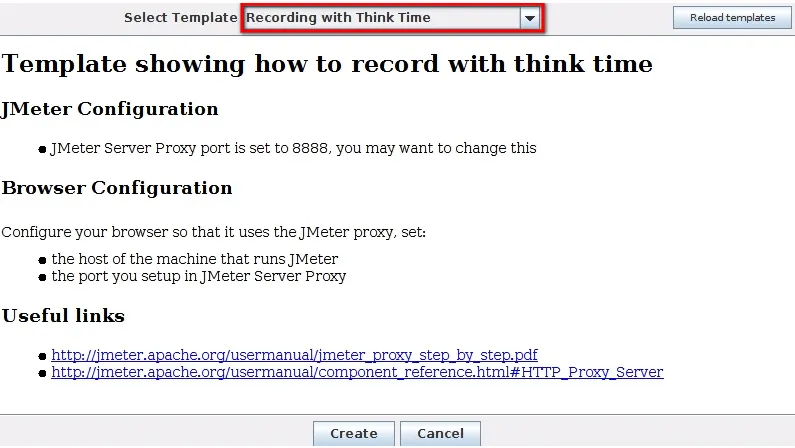
Figure 1.3: Recording template
- The test plan is ready:

Figure 1.4: Result of Recording template
- To save time in the future, we will select the HTTP Request Defaults element and fill in the Server Name or IP and Port Number sections:
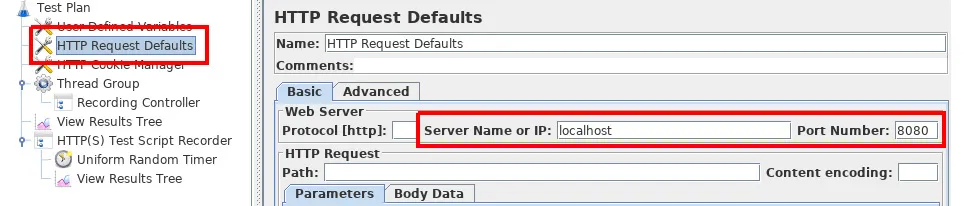
Figure 1.5: Result of Recording template
Note
With this trick, we will share these two fields in every element HTTP Request Defaults and JMeter will not put them in each HTTP Request during recording.Caution
During the load test, you should avoid having the injector (JMeter) on the same server as the application under test.Otherwise, the injected load will be impacted by the application's bad performance, and the application could be impacted by the injector's bad performance.Our tree is ready; we must now start the proxy server of JMeter.But before doing that, let's look at the HTTP(S) Test Script Recorder element. - For the name of recorded transactions, we have two options in Recorder:Transaction name, which allows you to fully name them as you wish.Prefix, which will just prepend the prefix to the default name given by JMeter, which is usually the URL path.
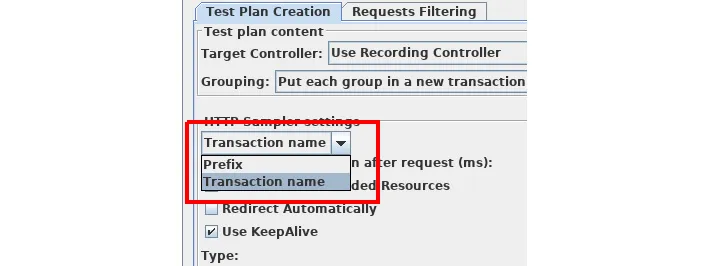
Figure 1.6: Transaction naming strategy
- Note that with the default configuration of the template, static resources (image, CSS file, JS file…) are not recorded:
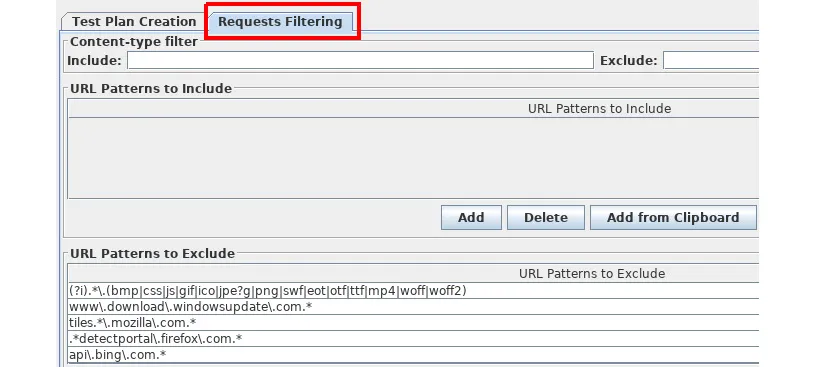
Figure 1.7: Exclude static resource capture
Configure Your Browser
- In order for JMeter to record the navigation session, we must configure our browser to use the proxy server that JMeter launched.
- For example, with Firefox, choose the menu Edit > Preferences:
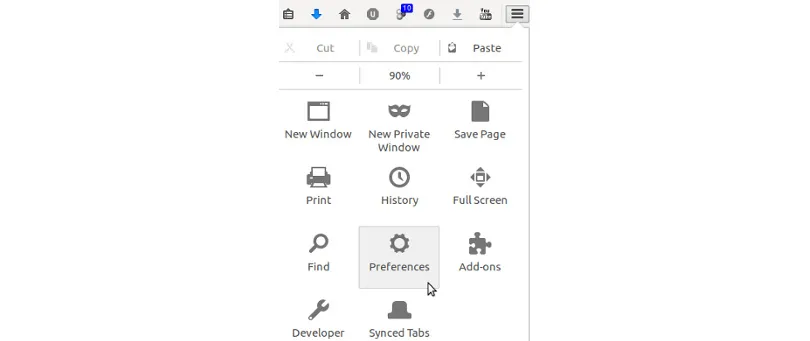
Figure 1.8: Proxy selection in Firefox
- Then select the Advanced tab and then the Network sub-tab. Let's click on Settings…:

Figure 1.9: Proxy selection in Firefox – Network
- In the new window, select the Manual proxy configuration option, then fill in the HTTP Proxy field with the following IP address: 127.0.0.1 (corresponding to the local IP address (localhost)), and fill in the Port field with 8888 (corresponding to the default listening port of the JMeter proxy server).
Caution
When recording a local application, be careful to delete localhost and 127.0.0.1 from the No Proxy for: field. - Finally, check the Use this proxy server for all protocols box.
- Let's save the modifications by clicking on the OK button in the Firefox window:

Figure 1.10: Proxy selection in Firefox – configuration
Save Our Script
- To do this, simply click the Start button on the HT...