eBook - ePub
Climate Change and Non-infectious Fish Disorders
Patrick T K Woo, George K Iwama, Patrick Woo, George K Iwama
This is a test
- English
- ePUB (adapté aux mobiles)
- Disponible sur iOS et Android
eBook - ePub
Climate Change and Non-infectious Fish Disorders
Patrick T K Woo, George K Iwama, Patrick Woo, George K Iwama
Détails du livre
Aperçu du livre
Table des matières
Citations
À propos de ce livre
An important new title on climate change, and its effects on selected non-infectious disorders of fish. Contains contributions by internationally recognized experts who have contributed significantly to our knowledge in this area.
Foire aux questions
Comment puis-je résilier mon abonnement ?
Il vous suffit de vous rendre dans la section compte dans paramètres et de cliquer sur « Résilier l’abonnement ». C’est aussi simple que cela ! Une fois que vous aurez résilié votre abonnement, il restera actif pour le reste de la période pour laquelle vous avez payé. Découvrez-en plus ici.
Puis-je / comment puis-je télécharger des livres ?
Pour le moment, tous nos livres en format ePub adaptés aux mobiles peuvent être téléchargés via l’application. La plupart de nos PDF sont également disponibles en téléchargement et les autres seront téléchargeables très prochainement. Découvrez-en plus ici.
Quelle est la différence entre les formules tarifaires ?
Les deux abonnements vous donnent un accès complet à la bibliothèque et à toutes les fonctionnalités de Perlego. Les seules différences sont les tarifs ainsi que la période d’abonnement : avec l’abonnement annuel, vous économiserez environ 30 % par rapport à 12 mois d’abonnement mensuel.
Qu’est-ce que Perlego ?
Nous sommes un service d’abonnement à des ouvrages universitaires en ligne, où vous pouvez accéder à toute une bibliothèque pour un prix inférieur à celui d’un seul livre par mois. Avec plus d’un million de livres sur plus de 1 000 sujets, nous avons ce qu’il vous faut ! Découvrez-en plus ici.
Prenez-vous en charge la synthèse vocale ?
Recherchez le symbole Écouter sur votre prochain livre pour voir si vous pouvez l’écouter. L’outil Écouter lit le texte à haute voix pour vous, en surlignant le passage qui est en cours de lecture. Vous pouvez le mettre sur pause, l’accélérer ou le ralentir. Découvrez-en plus ici.
Est-ce que Climate Change and Non-infectious Fish Disorders est un PDF/ePUB en ligne ?
Oui, vous pouvez accéder à Climate Change and Non-infectious Fish Disorders par Patrick T K Woo, George K Iwama, Patrick Woo, George K Iwama en format PDF et/ou ePUB ainsi qu’à d’autres livres populaires dans Technik & Maschinenbau et Fischerei & Aquakultur. Nous disposons de plus d’un million d’ouvrages à découvrir dans notre catalogue.
Informations
Sous-sujet
Fischerei & Aquakultur1 An Overview with Discussions on Freshwater and Marine Ecosystems in North America
1Annis Water Resources Institute, Grand Valley State University, Muskegon,Michigan,USA; 2Louisiana Universities Marine Consortium (LUMCON), Chauvin, Louisiana, USA
1.1 Overview on Climate Change
1.1.1 Weather and climate change
Weather, often confused with climate, are changes on an hourly, daily, weekly or monthly basis. Atmospheric temperatures may readily vary by as much 20°C within a single day. These are short-term changes with high variances. However, climate change describes large-scale changes from yearly to decadal to millions of years. It is an average of weather temperatures on an annual basis over long periods of time. Temperature change is part of what characterizes climate change. There are many aspects to climate change, of which changes in precipitation patterns, severe storm frequency and changes in average annual temperature, among others, are a part. Throughout geological history, Earth has experienced profound average temperature changes, with both intense increases and decreases, including those which precipitated the Ice Ages (McInerney and Wing, 2011; Engber, 2012). At this time in the history of Earth, we are experiencing higher temperatures over the entire planet, some more severe than others. For example, the northern hemisphere is warming faster than the southern hemisphere, particularly the Arctic and subarctic regions (Feulner et al., 2013); this is termed ‘global warming’.
1.1.2 Atmospheric warming and atmospheric carbon dioxide
Concentrations of atmospheric carbon dioxide (CO2) and other ‘greenhouse gases’ have been increasing to levels unprecedented over the last 800,000 years (World Meteorological Organization, 2017) and are now known to be responsible for the rise in average global temperatures that we are currently experiencing. This rise began during the Industrial Revolution, became particularly prominent during the 1930s and 1940s, and has been increasing ever since. The National Aeronautics and Space Administration’s (NASA) Godford Institute reports that global average temperatures have increased by ~0.9°C since 1880 (NASA, 2018) and are forecasted to continue to increase to at least 1.5°C above pre-industrial levels (IPCC, 2014); pre-industrial defined as the time prior to 1750. After 1750 England began burning abundant quantities of coal. Pre-industrial CO2 values have been reported at 278 ppm (Forster et al., 2007) increasing to ~392 ppm in 2011 (NOAA, 2011). Levels continued to increase and in 2017 were reported as 407.72 ppm, increasing to 409.22 by April 2018 (see NOAA, 2018) representing an annual mean 0.11 ppm/year growth rate. Tillmann and Siemann (2011) suggest projected levels may reach ~650 ppm by 2100 and perhaps exceed 1000 ppm in time (also see Meehl et al., 2007), causing catastrophic warming/heating consequences on ecosystems globally.
As atmospheric CO2 increases the oceans absorb ~40% of it (World Ocean Review, 2010) causing decreases in the pH of oceans worldwide (Orr et al., 2005; Riebesell and Gattuso, 2015). The decreased pH has a negative effect on the ability of many aquatic organisms (e.g. bivalves, corals) to effectively calcify processes, which, in turn, affects their survival. Feely et al. (2009) for instance suggest that pH in the oceans worldwide has already decreased from 8.2 to 8.1 (pre-industrial versus current values, respectively). Feely et al. (2010) also suggest that over the next 100 years, pH may decrease from 8.1 to 7.8. Should this happen, many organisms that depend upon aragonite for calcification will reach a critical threshold and be unable to form shells and for those that already have a shell, those will begin to dissolve as the water becomes more acidic. Less known are the effects of increasing atmospheric CO2 on freshwater lakes and rivers (Hasler et al., 2016). However, a recent study conducted by Weiss et al. (2018) over a 35-year period (1981–2015) examining two species of Daphnia (water fleas) in four reservoirs located in Germany showed a ~0.3 decrease in pH resulting in poor predator detection and decreased self-defence mechanisms against predation. Ou et al. (2015) similarly showed that decreases in pH in a freshwater habitat has negative consequences on pink salmon (Oncorhynchus gorbuscha), causing anti-predator behaviour and reductions in growth. The biological consequences of increased acidity in our aquatic ecosystems is impaired olfactory discrimination (Wisenden, 2000; Munday et al., 2009; Dixson et al., 2010; Midway et al., 2017) and appears to affect many different types of organisms in both marine and freshwater habitats.
1.1.3 Milankovitch cycles, seasonal changes
Global shifts between warming and cooling on Earth have been described as Milankovitch cycles (Rahmstorf and Schellnhuber, 2006), driven by variations in the orbital and axial movements of the Earth as it revolves around the sun. According to palaeoclimatological studies, warming or cooling events occur about every 100,000 years (Keeling and Whorf, 2000; Climate Literacy, 2009; Toggweiler and Lea, 2010) and are considered to be normal. According to this model, the Earth should be in a natural cooling cycle (OSS Foundation, 2018); however, since approximately 1850 (coinciding with the beginning of the Industrial Revolution), there has been a significant increase in the amount of CO2 added to the atmosphere and, as a consequence, rather than cooling, Earth has been deviating from its natural cycle and following a steady warming trend (OSS Foundation, 2018).
Over the last century, average atmospheric temperatures in western North America have increased by ~0.6–1.0°C (Tillmann and Siemann, 2011). In Alaska, temperatures increased by as much as ~1.9°C between 1949 and 2009 (US Global Change Research Program, 2009). Many investigators have projected that by 2100, the Earth will experience severe heat increases (see IPCC, 2013). For example, Peterson and Schwing (2008), Mote et al. (2010) and PRBO Conservation Science (2011) suggest temperature changes ranging from 1.5°C to as high as 7.2°C, with the greatest increases in the most northerly latitudes (e.g. Alaska). A compendium written by numerous researchers (IPCC; Intergovernmental Panel on Climate Change) indicate that while many people (including scientists, politicians, etc.) dismiss these predictions of changes as being alarmist, even the most conservative mathematical models of climate change predict that some increase in temperature change is likely. While most people hope for the least amount of change (i.e. 1.5°C), modelling suggests temperatures in excess of 6°C are more likely.
At the surface of this issue, many scientists are concerned about the potential increase in frequency and duration of each warming event (Union of Concerned Scientists, 2018a). What is more disconcerting is that, according to geological predictions, we are supposed to be in a cooling trend; but instead, the planet is warming (Budyko, 1972; Herring and Simmon, 2007; Phipps cited in Andrews, 2016). This suggests that the next natural cycle will be a warming trend, thus compounding the problem. Gerald Meehl (National Center for Atmospheric Research) suggests that over the last few decades, the number of warming trends is approximately twice the number of cooling trends across the USA, but by 2050, that ratio is expected to increase from 2:1 to more than 20:1 (warming versus cooling, respectively) (Meehl et al., 2007). The number of warming versus cooling events from weather stations scattered across the contiguous USA show more warming events since the 1980s compared with cooling trends (Fig. 1.1).
As the number of warming days outpaces the number of cooling days, seasons will begin to shift (Fig. 1.2) with earlier springs, longer summers and autumn weather beginning later in the year. In fact, in the northern hemisphere, over much of the continental USA, winter is becoming shorter in duration due to warming weather conditions with temperatures in many northern states, such as Montana, Minnesota and Michigan which are experiencing temperatures well above normal mean maximums characteristic of the 1970s. In some of the more southerly states such as California and Texas, seasonal shifts are already being observed during the spring and autumn seasons (Fig. 1.3).
It is easy to confuse wide variations in weather conditions and climate change. By following average temperatures over long periods of time, it is clear the Earth is becoming warmer. As the atmosphere warms, positive feedback loops are induced, and warmer air will produce increased precipitation (Fig. 1.4).
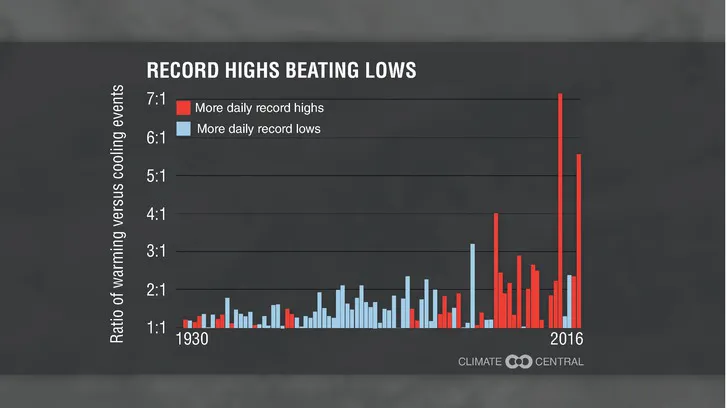
Fig. 1.1. The number of high warming trends outpacing the number of cooling trends from 1930 to 2016. (Reprinted from Climate Central, 2017, with permission.)
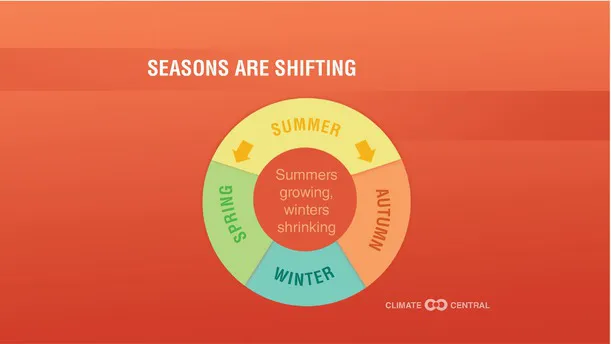
Fig. 1.2. As warming trends begin to outpace cooling trends each decade, expected changes include shifting seasons where summer lasts longer. (Adapted from Climate Central, 2017, with permission.)
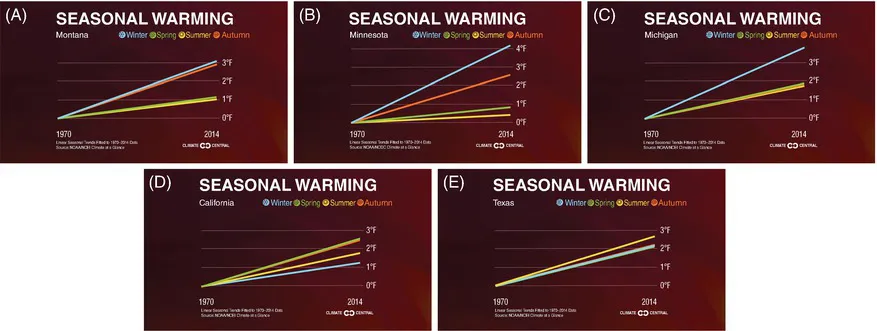
Fig. 1.3. Season mean temperatures from the 1970s through to 2014 are compared in (A) Montana, (B) Minnesota, (C) Michigan, (D) California and (E) Texas. (Adapted from Climate Central, 2017, with permission.)
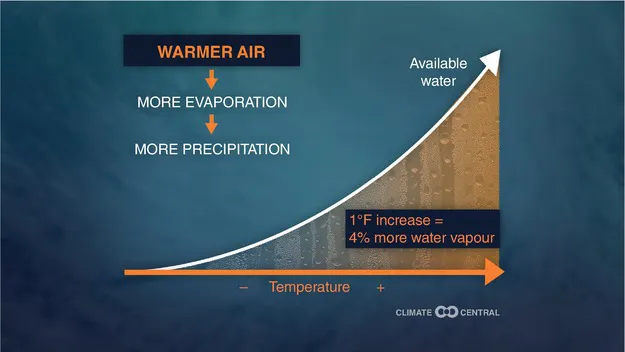
Fig. 1.4. The relationship between the warming atmosphere and its effect on precipitation. (Adapted from Climate Central, 2017, with permission.)
If the Earth’s climate continues to warm, this will affect both our terrestrial and marine climatic zones, their environmental characteristics (e.g. polar ice caps), and the organisms that reside within them. For instance, for every 0.6°C (1.0°F) increase in temperature, the atmosphere can hold 4% more water vapour (Climate Central 2017). As a consequence, rather than equal volumes of snow being observed in northern climates/latitudes from year to year, more rain (rather than snow) may be experienced. In more tropical areas, that does not necessarily mean there will be more precipitation, mainly because the atmosphere in those areas can hold that water without condensing and producing rain. This is why the Sahara Desert has been expanding in recent decades (Thomas and Nigam, 2018; University of Maryland, 2018).
In the northern latitudes, the polar ice caps, which are the result of snow accumulated over thousands of years, will also decrease as a result of this warming. As snow and ice continue to melt and disappear, the reflectivity or albedo (Zeng and Yoon, 2009) of the Earth will decrease and more radiant energy from the sun will be absorbed by the land and the waters. The northern hemisphere possesses more land than the southern hemisphere, and the question arises whether there will be le...
Table des matières
Normes de citation pour Climate Change and Non-infectious Fish Disorders
APA 6 Citation
[author missing]. (2020). Climate Change and Non-infectious Fish Disorders ([edition unavailable]). CABI. Retrieved from https://www.perlego.com/book/1350749/climate-change-and-noninfectious-fish-disorders-pdf (Original work published 2020)
Chicago Citation
[author missing]. (2020) 2020. Climate Change and Non-Infectious Fish Disorders. [Edition unavailable]. CABI. https://www.perlego.com/book/1350749/climate-change-and-noninfectious-fish-disorders-pdf.
Harvard Citation
[author missing] (2020) Climate Change and Non-infectious Fish Disorders. [edition unavailable]. CABI. Available at: https://www.perlego.com/book/1350749/climate-change-and-noninfectious-fish-disorders-pdf (Accessed: 14 October 2022).
MLA 7 Citation
[author missing]. Climate Change and Non-Infectious Fish Disorders. [edition unavailable]. CABI, 2020. Web. 14 Oct. 2022.