Air transport industry finance, with its complexity and special needs such as route rights, airport slots, aircraft leasing options and frequent flyer programmes, requires specific knowledge. While there are numerous financial management and corporate finance texts available, few of these provide explanations for the singularities of the airline industry with worked examples drawn directly from the industry itself. Revised and updated in its third edition, this internationally renowned and respected book provides the essentials to understanding all areas of airline finance. Designed to address each of the distinct areas of financial management in an air transport industry context, it also shows how these fit together, while each chapter and topic provides a detailed resource which can be also consulted separately. Supported at each stage by practical airline examples, it examines the financial trends and prospects for the airline industry as a whole, contrasting the developments for the major regions and airlines. Important techniques in financial analysis are applied to the airline industry, together with critical discussion of key issues. Thoroughly amended and updated throughout, the third edition reflects the many developments that have affected the industry since 2001. It features several important new topics, including Low Cost Carriers (LCCs), fuel hedging and US Chapter 11 provisions. The sections on financial statements and privatisation have been expanded, and a new chapter has been added on equity finance and IPOs. New case studies have been added, as well as the latest available financial data. The range and perspective is even greater than before, with significant expansion of material specific to the US and Asia. The book is a key resource for students of airline management, and a sophisticated and authoritative guide for analysts in financial institutions and consultancies, executives in airlines and related industries, and civil aviation departments.
Foire aux questions
Comment puis-je résilier mon abonnement ?
Il vous suffit de vous rendre dans la section compte dans paramètres et de cliquer sur « Résilier l’abonnement ». C’est aussi simple que cela ! Une fois que vous aurez résilié votre abonnement, il restera actif pour le reste de la période pour laquelle vous avez payé. Découvrez-en plus ici.
Puis-je / comment puis-je télécharger des livres ?
Pour le moment, tous nos livres en format ePub adaptés aux mobiles peuvent être téléchargés via l’application. La plupart de nos PDF sont également disponibles en téléchargement et les autres seront téléchargeables très prochainement. Découvrez-en plus ici.
Quelle est la différence entre les formules tarifaires ?
Les deux abonnements vous donnent un accès complet à la bibliothèque et à toutes les fonctionnalités de Perlego. Les seules différences sont les tarifs ainsi que la période d’abonnement : avec l’abonnement annuel, vous économiserez environ 30 % par rapport à 12 mois d’abonnement mensuel.
Qu’est-ce que Perlego ?
Nous sommes un service d’abonnement à des ouvrages universitaires en ligne, où vous pouvez accéder à toute une bibliothèque pour un prix inférieur à celui d’un seul livre par mois. Avec plus d’un million de livres sur plus de 1 000 sujets, nous avons ce qu’il vous faut ! Découvrez-en plus ici.
Prenez-vous en charge la synthèse vocale ?
Recherchez le symbole Écouter sur votre prochain livre pour voir si vous pouvez l’écouter. L’outil Écouter lit le texte à haute voix pour vous, en surlignant le passage qui est en cours de lecture. Vous pouvez le mettre sur pause, l’accélérer ou le ralentir. Découvrez-en plus ici.
Est-ce que Airline Finance est un PDF/ePUB en ligne ?
Oui, vous pouvez accéder à Airline Finance par Peter S. Morrell en format PDF et/ou ePUB ainsi qu’à d’autres livres populaires dans Business et Business General. Nous disposons de plus d’un million d’ouvrages à découvrir dans notre catalogue.
The airline industry has over the years been buffeted by both economic cycles and threats from terrorism and epidemics. Following seven years of good profitability that stemmed from a relatively long world economic upswing between 1994 and 2000, it suffered a severe setback in the 2000s with the post ‘year 2000’ downturn and the aftermath of 9/11. Cumulative net losses of the world’s scheduled airlines amounted to US$20.3 billion between 1990 and 1993, but this was followed by almost $40 billion in net profits between 1995 and 2000. This highlights the cyclical nature of the industry, and the need to treat with caution comments after the Gulf War recession and 9/11 about the continued ability of the industry to finance expansion.
Since the end of the early 1990s recession, the airlines’ balance sheets have been considerably strengthened, even allowing for the replacement of large numbers of noisier aircraft that did not meet the current Chapter 3 standards. ICAO figures show the debt/equity ratio for the world’s scheduled airlines declining from a high of 2.90:1 at the end of 1993 to 1.42:1 at the end of 1999. This had deteriorated to 2.46:1 in 2003, before improving somewhat to 2.41:1 in 2004.1
1 ICAO: Tables A-4 from Financial data.
Clouds appeared on the horizon in 1999, with the price of jet fuel jumping from 40 cents per US gallon a barrel to 75 cents in January 2000. This led to a drop in operating profits, although net profits were maintained largely due to the sale of aircraft and non-core investments such as holdings in IT and communications companies. The dollar price of fuel in 2001 was still well below its high in 1981. At that time fuel expenses rose to just under 30 per cent of total airline operating expenses. In 2000, they were still only 12 per cent of the total, even after recent sharp increases. This has been helped by substantial advances in fuel efficiency. For example, British Airways has reduced its average fuel consumption in terms of grams per revenue tonne-km from around 440 in 1990/1991 to 345 in 1999/2000 (or by an average of 2.6 per cent a year), and is on track to meet its target of 306 g in 2010.2
2 British Airways, (2000), Social and Environmental Report 2000.
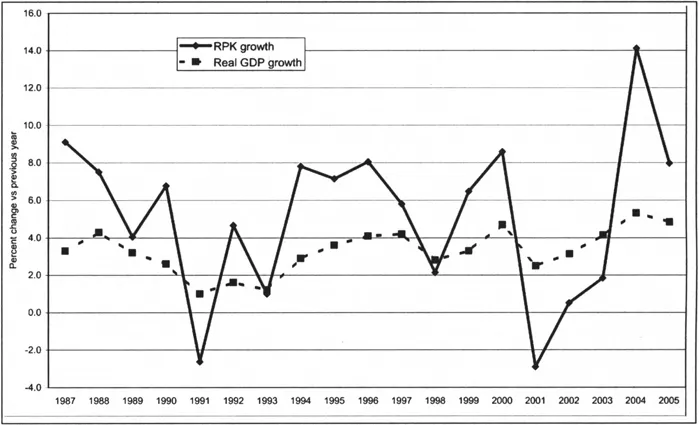
As stated above, the fuel price started increasing alarmingly in early 1999; a further advance occurred at the end of summer 2000 to a high of 107 cents, before the price fell back to around 75 cents by the end of 2000.3 The next period of instability was in 2004, when prices ranged from a low of 92 to a high of 157 cents per US gallon. In the following year the range rocketed up to 119–223 cents, and the 2005 high of 223 cents was again reached in August 2006. Some economists link any sudden and substantial rise in fuel prices to an economic recession about 18 months later. This appeared to be happening in 2001, as the downturn in the US economy began to have a serious effect on Asian exports, especially for countries such as Taiwan and Federation of Malaysia. The impact of declining GDP for the major world economies such as the US, EU and Japan has in the past led to a downturn in traffic (Figure 1.1). The first ever decline (as opposed to large reduction in growth rate) in world air traffic growth in 1991 was due to the combined effects of the Gulf War and the world economic recession, with a second in 2001.
3 Lufthansa Cargo Website, (2001). Retrieved from www.lufthansa.com average of spot jet fuel prices for Rotterdam, Mediterranean, Far East Singapore, US Gulf and West Coast.
Figure 1.1ICAO scheduled airline traffic growth vs world GDP growth
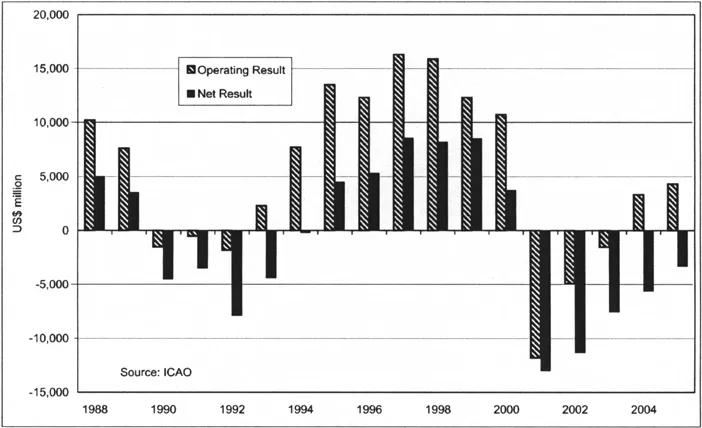
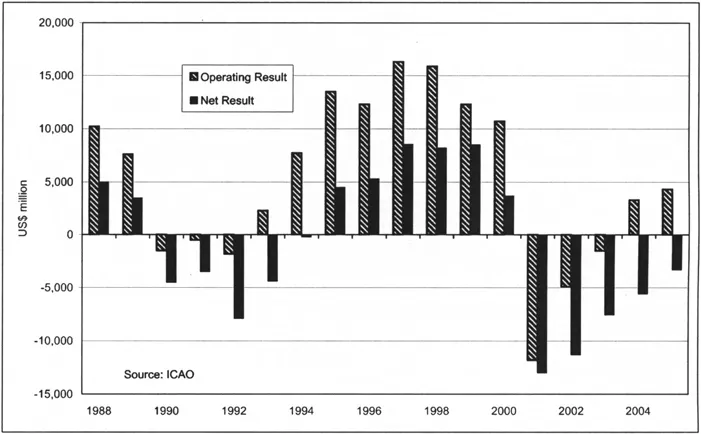
Figure 1.2 shows the cyclical nature of past financial results for the world’s scheduled airlines. As mentioned above, the impact of rising fuel prices on costs resulted in a deterioration in operating results for 1999 and 2000, and a slowing of the recovery in 2004/2005. Other cost items such as flight crew salaries also rose sharply for some airlines in 2000/2001, but this has been cushioned to some extent by lower distribution costs. The Asian financial crisis of 1997/1998 can be seen to have had little effect on the fortunes of the world’s airlines, but a significant impact on a number of Asian carriers (see Figure 1.4). The SARS health threat of 2003 was more local, affecting carriers such as Cathay Pacific most severely.
The difference between the operating and net profit is caused by net interest paid, gains or losses on asset sales, taxes and subsidies, and provisions for restructuring. Interest paid is the largest of these items, and this has declined in the second half of the 1990s due to the combined effects of falling interest rates and lower debt outstanding. Profits from asset sales also make a good contribution in some years, generating over $2 billion in both 1998 and 2003.
Preliminary estimates for 2005 suggest that the recovery is continuing, and in 2006 even some of the ailing US legacy carriers reported profits. However, the cyclical pattern looks like recurring once higher oil prices start to affect consumer and business spending. Their impact on airlines in 2005–2006 could be mitigated by passing on some of fuel cost increases to consumers, against a background of strong demand. The danger is the combined impact of weak demand and continued high oil prices. The other difference this time is that more airlines are privately owned, and subsidies might be not be forthcoming. However, the re-nationalisation of Malaysian Airlines and Air New Zealand (see Chapter 7) suggests that air transport may still receive special treatment. Subsidies approved by the European Commission for payment to just five European airlines (Olympic Airways, TAP Air Portugal, Iberia, Air France and Aer Lingus) between 1992 and 1997 totalled US$8.94 billion, or almost 17 per cent of the sum of the airlines’ three previous years’ revenues.4 On the basis that they were paid in equal instalments over the 5 years, 1992–1997, this would have amounted to $1.8 billion a year. By 2006, two of these airlines had been successfully privatised, and a third radically transformed into a profitable airline expected to be privatised by 2007. The last two, TAP and Olympic, are still loss-making and defy efforts to privatisation.5
4 Cranfield University (1997), Single Market Review, 1996: Impact on Services - Air Transport, Kogan Page for the European Commission.
5 Unable to sell the airline, they both split off ground handling services with the intention of privatising that separately.
ICAO stress that published operating and net results are susceptible to ‘substantial uncertainties’.6 This is particularly the case with the net results, which are the small differences between estimates of large figures (revenues and expenses). Just under 15 per cent of revenues and expenses are estimated for non-reporting airlines. The increased use of operating leases over the second part of the 1980s has tended to switch the emphasis of costs from non-operating interest on loans or finance leases to rentals, included in operating expenses. Thus, net interest paid would have increased further, had this trend not occurred. ICAO report that the share of aircraft rentals in operating expenses has increased from 5.3 per cent in 1994 to 7.4 per cent in 2004, despite the interest rate element of the rentals down sharply over this period.
6ICA O Journal, 18 (July/August 1996).
Figure 1.3ICAO scheduled airline financial results as per cent revenues
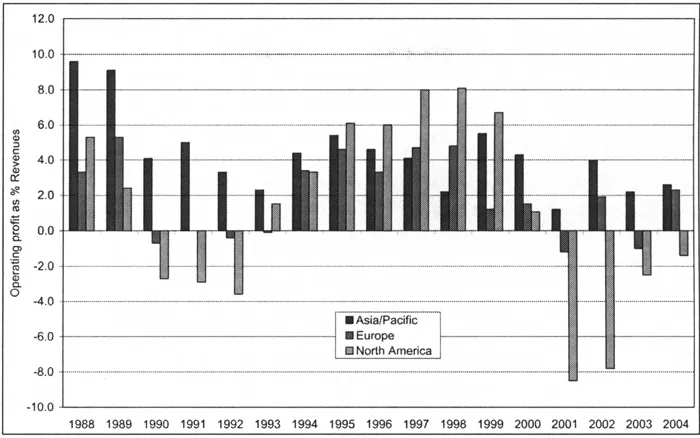
The operating margin for the world’s scheduled airlines only exceeded 5 per cent twice during the 1980s. This improved marginally to just three years in the 1990s (Figure 1.3) and none between 1998 and 2005. Smaller airlines would require higher margins to survive than larger, and two relatively small airlines, Gol of Brazil and Jet Airways of India, were amongst the top five world airlines in 2005 both with ratios of 22 per cent. Southwest, now a US major, achieved 18 per cent in 200 but was down to 10 per cent in 2005, and two Asian airlines, Singapore and Cathay Pacific, have traditionally been among the leaders of the larger world airlines.7Figure 1.4 shows the financial margins for the world’s airlines according to the region in which they are based. It shows that the North American airlines were hardest hit by the Gulf War recession, with a number going out of business, and the remainder surviving by obtaining new equity and debt finance. As mentioned above, some of the European airlines were more fortunate in obtaining government support. Asian based airlines were the least affected by the Gulf War recession, and experienced much better margins than airlines of other regions in the early 1990s. European airlines as a whole broke even, but the US airlines were mainly responsible for the large world airline operating losses of the early 1990s. The US airline problems in fact began before the Gulf War and early 1990s recession. Their unit costs and capacity both rose strongly in 1989 and 1990, resulting in a large loss in 1990.
7 Financial Analysis: The Airline Rankings (2001), Airline Business, September, p. 62.
Figure 1.4Operating result as per cent revenues by region of airline
Source: The World of Civil Aviation, ICAO
A similar picture emerged after 9/11 with the North American airlines most badly affected. The European airlines recovered fairly quickly in 2002, but were hit in 2003 by the strength of the Euro, the Iraq War and SARS on Far Eastern routes.
The recovery of Asian economies, and the Asian airlines, from the region’s 1997 financial crisis has been remarkable. The 18 members of the Association of Asia Pacific Airlines (AAPA) reported collective after-tax profits of US$1.88 billion for 1999/2000, a four-fold increase from the previous year. This contrasted with their combined loss of US$1.21 billion in 1997/1998, only two years previously.8 This recovery stemmed principally from the bounce back of the economies of the region, but also from the success of implementing cost controls (apart from fuel costs which rose by 20....