CHAPTER 1
Introduction to Spectroscopy
David Lee Nelson
CONTENTS
1.1UV–Visible Spectroscopy
1.2Fluorescence Spectroscopy
1.3Fourier Transform IR Spectroscopy
1.3.1Attenuated Total Reflectance
1.3.2Diffuse Reflectance Infrared Fourier Transform Spectroscopy
1.4NIR Spectroscopy
1.5Raman Spectroscopy
1.6Nuclear Magnetic Resonance
1.7Ultrasound Spectroscopy
1.8Multivariate and Chemometric Analyses
1.9Conclusion
References
Spectroscopy has had an ever-increasing role in the determination of the composition and adulteration of foods and beverages. It is important for determining food safety, accompanying food and beverage production, and for the control of food, beverages, and packaging in general.
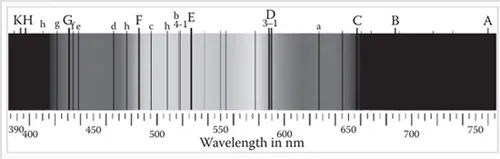
The study of spectroscopy is considered to have begun with Isaac Newton’s experiments with the dispersion of light into its components of various wavelengths with the aid of a prism (Thomas 1991; James 2007). However, nothing more was studied until the time of William Wollaston, who improved upon Newton’s experiment in 1802. The dark lines that appeared in the spectrum (Figure 1.1) were later studied by Joseph von Fraunhofer (Jackson 2000), followed by Anders J. Angstrom, who measured the wavelengths of these lines. Fraunhofer also constructed a grating that achieved greater resolution in the dispersion of light than the prism (Pasquini 2003). Sir John Herschel studied the spectrum of flames in 1822 and laid the foundation for spectral analyses. In 1859, Gustav Kirchhoff suggested that substances emitted and absorbed light at the same wavelength. These and other studies were the basis of Bohr’s theory of the atom, which specified that electrons existed in discrete energy levels in the atom (Thomas 1991). August Beer later proposed the linear relationship between absorbance and concentration, which has since been the basis for the quantitative determination of substances by measurements of absorbance or transmittance in the visible and ultraviolet (UV) regions (Thomas 1991).
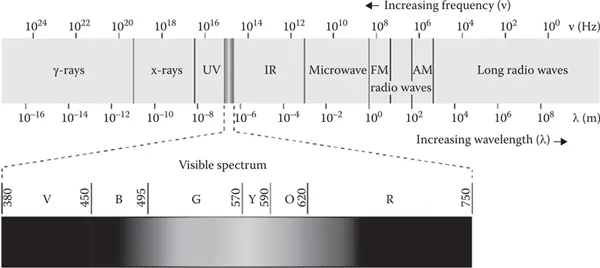
Electromagnetic radiation consists of electromagnetic waves, which are synchronized oscillations of electric and magnetic fields that propagate at the speed of light through a vacuum. The oscillations of the two fields are perpendicular to each other and perpendicular to the direction of energy and wave propagation, forming a transverse wave. Electromagnetic waves can be characterized by either the frequency or wavelength of their oscillations, which determines their position in the electromagnetic spectrum (Crowell 2013). Electromagnetic radiation involves a wide range of wavelengths, as is shown in Figure 1.2. The electromagnetic spectrum refers to all the known frequencies and their linked wavelengths of the known photons. The electromagnetic spectrum extends from above the long wavelengths (high frequencies) used for modern radio communication to gamma radiation at the short-wavelength (high-frequency) end, thereby covering wavelengths from thousands of kilometers down to a fraction of the size of an atom (Mehta 2011). The range of energies involved in this range of wavelengths varies from 12.4 feV to 1.24 Mev. In principle, the upper limit for the possible wavelengths of electromagnetic radiation is the dimension of the universe. The theoretical lower limit is thought to be the Planck length (1.616199(97) × 10−35 m) (Bakshi and Godse 2009). Although all the wavelengths shown in Figure 1.2 can be used for analysis, the range of wavelengths usually employed in spectroscopy is relatively narrow and includes mainly the UV, visible, infrared (IR), ultrasound, and FM radio (nuclear magnetic resonance [NMR]) regions.
1.1 UV–Visible Spectroscopy
UV light was discovered by J. W. Ritter in 1801 (Thomas 1991). However, there remained no method by which to measure UV radiation until the development of the photodetector in the 1930s. The first commercial UV–visible (UV–Vis) spectrophotometer was introduced by Beckman in 1941 (Buie 2011).
The absorbance of light in the UV–Vis region occurs when an electron is excited and passes from a bonding or nonbonding orbital to an antibonding orbital. The amount of energy required to excite an electron depends on the difference in energy between the ground state and the excited state. Transitions of the σ–σ*, σ–π*, π–σ*, or simple π–π* type require light in the vacuum UV region. However, conjugated π systems exhibit π–π* transitions that absorb in the region between 200 and 800 nm. In conjugated systems, the excited state is more greatly stabilized by resonance than the ground state, so the difference in energy between the two states is smaller than in nonconjugated systems (Silverstein et al. 1974). The smaller the difference in energy between the ground state and the excited state, the greater is the probability that a transition between the ground state and the excited state will occur. The intensity of the absorbance is a function of this probability. For a given concentration, the intensity of absorbance will be greater when the difference in energy between the ground and excited state is small. And, this difference will be smaller when there is a greater degree of conjugation in the molecule.
The nonbonding (n) electrons normally have a higher energy than the ground state pi electrons. The nonbonding electrons are held less strongly. Therefore, the difference in energy between the nonbonding orbitals and the antibonding (π*) orbital is small, and the absorbance corresponding to this n–π* transition occurs at a longer wavelength than the π–π* transition. However, the nonbonding orbitals are perpendicular to the π* orbitals, and there is very little overlap between the two. Therefore, the probability that a nonbonding electron will be excited to a π* orbital is extremely small, and the intensity of the corresponding absorbance will also be very low. This transition is said to be “forbidden.”
The absorption bands in the UV–Vis region are very wide. The electronic state is made up of several vibrational energy sublevels. These different vibrational energy levels are each composed of several rotational energy levels. The energy differences between the vibrational levels are much smaller than ...