
eBook - ePub
Handbook Of Flow Visualization
Wen Jei Yang
This is a test
Partager le livre
- 272 pages
- English
- ePUB (adapté aux mobiles)
- Disponible sur iOS et Android
eBook - ePub
Handbook Of Flow Visualization
Wen Jei Yang
Détails du livre
Aperçu du livre
Table des matières
Citations
À propos de ce livre
With contributions from some of the world's leading experts, the second edition of this classic reference compiles all major techniques of flow visualization and demonstrates their applications in all fields of science and technology. A new chapter has been added that covers flow visualization applications in large wide tunnels for airplane and automobile testing. Several important examples of applications are included. A second new chapter details the use of infrared (IR) cameras for detecting and observing the boundary layer transition in industrial wind tunnels and flight testing of commercial transport airplanes. A final new chapter has been added on multiphase flow and pulsed-light velocimetry.
Foire aux questions
Comment puis-je résilier mon abonnement ?
Il vous suffit de vous rendre dans la section compte dans paramètres et de cliquer sur « Résilier l’abonnement ». C’est aussi simple que cela ! Une fois que vous aurez résilié votre abonnement, il restera actif pour le reste de la période pour laquelle vous avez payé. Découvrez-en plus ici.
Puis-je / comment puis-je télécharger des livres ?
Pour le moment, tous nos livres en format ePub adaptés aux mobiles peuvent être téléchargés via l’application. La plupart de nos PDF sont également disponibles en téléchargement et les autres seront téléchargeables très prochainement. Découvrez-en plus ici.
Quelle est la différence entre les formules tarifaires ?
Les deux abonnements vous donnent un accès complet à la bibliothèque et à toutes les fonctionnalités de Perlego. Les seules différences sont les tarifs ainsi que la période d’abonnement : avec l’abonnement annuel, vous économiserez environ 30 % par rapport à 12 mois d’abonnement mensuel.
Qu’est-ce que Perlego ?
Nous sommes un service d’abonnement à des ouvrages universitaires en ligne, où vous pouvez accéder à toute une bibliothèque pour un prix inférieur à celui d’un seul livre par mois. Avec plus d’un million de livres sur plus de 1 000 sujets, nous avons ce qu’il vous faut ! Découvrez-en plus ici.
Prenez-vous en charge la synthèse vocale ?
Recherchez le symbole Écouter sur votre prochain livre pour voir si vous pouvez l’écouter. L’outil Écouter lit le texte à haute voix pour vous, en surlignant le passage qui est en cours de lecture. Vous pouvez le mettre sur pause, l’accélérer ou le ralentir. Découvrez-en plus ici.
Est-ce que Handbook Of Flow Visualization est un PDF/ePUB en ligne ?
Oui, vous pouvez accéder à Handbook Of Flow Visualization par Wen Jei Yang en format PDF et/ou ePUB ainsi qu’à d’autres livres populaires dans Technology & Engineering et Mechanical Engineering. Nous disposons de plus d’un million d’ouvrages à découvrir dans notre catalogue.
Informations
PART
1 Fundamentals
CHAPTER
1 Introduction
Fluid flow, heat and mass transfer, and electrical flow deal with the transfer of physical properties such as momentum, energy, mass, and electricity. Called transport phenomena, they can be investigated both by experiment and by theory. Experimental flow study can be performed in the forms of flow measurement and flow visualization, while the theoretical approach includes analysis and computation as shown in Fig. 1. The task of visualization is to make the process of transport phenomena visible. This can be done through experiments or by simulation (theory). Flow visualization is superior to flow measurement in that the physical phenomena in the entire flow field are retrieved. However, because the information obtained is qualitative, the technique has been inherently penalized (Table 1). The advance of computing machines has led flow visualization into a new era of quantifying the flow information, and thus, the fatal shortcoming of the conventional method has been overcome.
TABLE 1 Comparison of Flow Experiments
| Flow Measurement | Flow Visualization | |
| Range | Local | Whole field |
| Information | Qualitative | Quantitative |
For convenience, the methods used in flow visualization are classified as either conventional or computer assisted. The former, referred to as the first-generation method, includes all traditional techniques in use since the time of Leonardo da Vinci (1452–1519). These techniques are classified into four groups in Table 2: wall tracing, tuft, tracer, and optical methods. The applicable flow range for various methods is presented in Fig. 2. One major objective of research in flow visualization is the extension of the flow range in both directions, toward higher as well as lower velocities.
In general, different substances are introduced into the flow field as a contrast medium or as a tracer to distinguish the object to be observed. Very often, the flow field needs to be illuminated in order to achieve the field image of high contrast and resolution. The image is then displayed in an appropriate form. This is the general practice in conventional flow visualization techniques. The image thus obtained provides only qualitative information about the flow field. In the case of computer-assisted flow visualization methods the above-mentioned process, called image formation, is to be followed by digital image processing. This results in better quality images being displayed. The image-acquisition system includes both the conventional flow visualization device and the imaging device, often referred to as machine vision. Recent advances in computational techniques and computer color graphics have contributed to a new era in flow visualization. Results obtained by theory, measurement, and their combination can be displayed, using colors as the parametric variables. The results can also be stored in the computer for reprocessing. Figure 3 summarizes the computer-aided flow visualization techniques, while Table 3 compares the differences between the first- and second-generation methods of flow visualization.
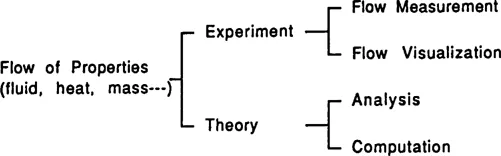
Fig. 1 Methods to study flow of properties.
TABLE 2 Conventional Flow Visualization Methods
| Method | Type |
| Wall tracing | Liquid film |
| Sublimation | |
| Thermosensible paint | |
| Electrolytic etching | |
| Soluble chemical fil... |