
eBook - ePub
Three Dimensional Applications In GIS
Jonathan Raper, Jonathan Raper
This is a test
Partager le livre
- 280 pages
- English
- ePUB (adapté aux mobiles)
- Disponible sur iOS et Android
eBook - ePub
Three Dimensional Applications In GIS
Jonathan Raper, Jonathan Raper
Détails du livre
Aperçu du livre
Table des matières
Citations
À propos de ce livre
Provides a survey of the approaches used and the problems encountered in the model of real geophysical data.
Foire aux questions
Comment puis-je résilier mon abonnement ?
Il vous suffit de vous rendre dans la section compte dans paramètres et de cliquer sur « Résilier l’abonnement ». C’est aussi simple que cela ! Une fois que vous aurez résilié votre abonnement, il restera actif pour le reste de la période pour laquelle vous avez payé. Découvrez-en plus ici.
Puis-je / comment puis-je télécharger des livres ?
Pour le moment, tous nos livres en format ePub adaptés aux mobiles peuvent être téléchargés via l’application. La plupart de nos PDF sont également disponibles en téléchargement et les autres seront téléchargeables très prochainement. Découvrez-en plus ici.
Quelle est la différence entre les formules tarifaires ?
Les deux abonnements vous donnent un accès complet à la bibliothèque et à toutes les fonctionnalités de Perlego. Les seules différences sont les tarifs ainsi que la période d’abonnement : avec l’abonnement annuel, vous économiserez environ 30 % par rapport à 12 mois d’abonnement mensuel.
Qu’est-ce que Perlego ?
Nous sommes un service d’abonnement à des ouvrages universitaires en ligne, où vous pouvez accéder à toute une bibliothèque pour un prix inférieur à celui d’un seul livre par mois. Avec plus d’un million de livres sur plus de 1 000 sujets, nous avons ce qu’il vous faut ! Découvrez-en plus ici.
Prenez-vous en charge la synthèse vocale ?
Recherchez le symbole Écouter sur votre prochain livre pour voir si vous pouvez l’écouter. L’outil Écouter lit le texte à haute voix pour vous, en surlignant le passage qui est en cours de lecture. Vous pouvez le mettre sur pause, l’accélérer ou le ralentir. Découvrez-en plus ici.
Est-ce que Three Dimensional Applications In GIS est un PDF/ePUB en ligne ?
Oui, vous pouvez accéder à Three Dimensional Applications In GIS par Jonathan Raper, Jonathan Raper en format PDF et/ou ePUB ainsi qu’à d’autres livres populaires dans Historia et Historia bizantina. Nous disposons de plus d’un million d’ouvrages à découvrir dans notre catalogue.
Informations
Chapter 1
Three dimensional display of geologic data
J. Nicholas Van Driel
Introduction
The increasing volume of available data and developments in computer graphics have provided an environment in which automated techniques for analysis and display of geologic information in three dimensions can be used to solve complex geologic problems. Computer techniques that are used to study geology can be divided into three classes: two dimensional analysis and display, three dimensional display, and three dimensional analysis. 2D techniques have been used by geologists for many years in the form of software for computer graphics, image processing, and more recently, as geographic information systems or GIS. 2D display representations include surfaces, multiple layers, fence diagrams, and stereo images. These 2D processes are excellent tools for storing, manipulating and combining surfaces, but geologists require 3D capabilities for most applications.
The next step up in complexity, 3D display, provides better ways to examine and communicate information through the use of fence diagrams, isometric surfaces, multiple surfaces, and stereo block diagrams. However, most 3D display techniques are limited to the two dimensional format of a CRT screen or plotter paper. The displays can be viewed, but they can’t be analyzed as discrete entities, for example the solid cannot be measured, stretched, reshaped, or combined. True 3D analysis or 3D GIS, with a continuous volumetric data structure and appropriate analytical functions, would give geologists the tool to integrate a variety of data sources, store all the available information about a portion of the earth’s crust, and operate on solid bodies as discrete entities. The further capacity to manipulate and analyze a 3-D body is the next logical technique that should be made available to geologists.
This paper focuses on the middle range of capabilities, 3D display, and describes some of the techniques that are available to geologists to help them analyze and communicate their information. The capabilities are available on a variety of machines, and use both proprietary and user-written software. The paper concludes with a discussion of the general requirements for 3D analysis.
Three-dimensional display
The most important advantage of using 3D displays is the way they appeal to our brains and to our eyes. A 2D plot of individual elevations on a surface doesn’t spark much of an image when we look at it; a contoured surface is a little better, but the viewer is required to build the image in his mind. A wireframe perspective display in color makes the surface come alive. All of the details, as well as the general trends, are immediately visible. 3D displays portray data, which are a sample of the real world, in a manner that resembles how they actually appear in the real world. It is estimated that fifty percent of the brain’s neurons are involved in vision. 3D displays light up more neurons and thus involve a larger portion of our brains in solving a problem. This phenomenon is particularly important to geologists who use visualization to solve 3D problems by observing a relatively small portion of the rock units that are exposed, and then using judgment, experience, and imagination to extrapolate the areas that are hidden.
The computer-aided 3D display techniques mimic the manual techniques that have been developed and used by geologists for many years. Contours on a surface from point elevations, fence diagrams, multiple surfaces and perspective drawings, originally done by hand, can now be produced quickly and efficiently by a wide variety of computer programs.
Surfaces
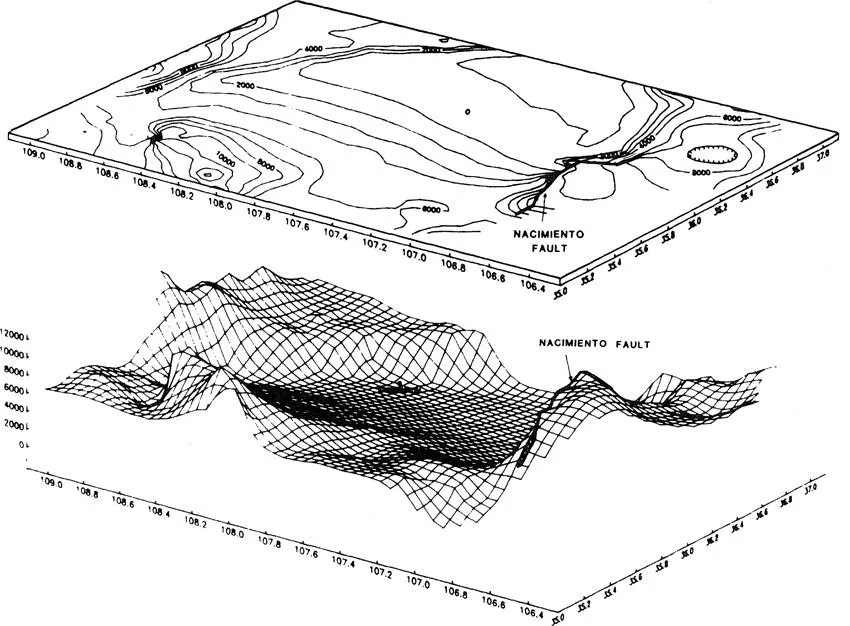
Surfaces are used in a variety of ways to represent geological information. The most common form, structure contour maps, can communicate the shape of a surface to people who are trained to use contour maps, but it takes some time and visualization skill to organize the information and build a mental picture of the surface. In contrast, anyone can instantly see the shape and details of a surface that is displayed as a wireframe perspective. The viewer of the 3D display can spend less time creating the image and more time analyzing it. Figure 1.1 shows the difference in these two views.
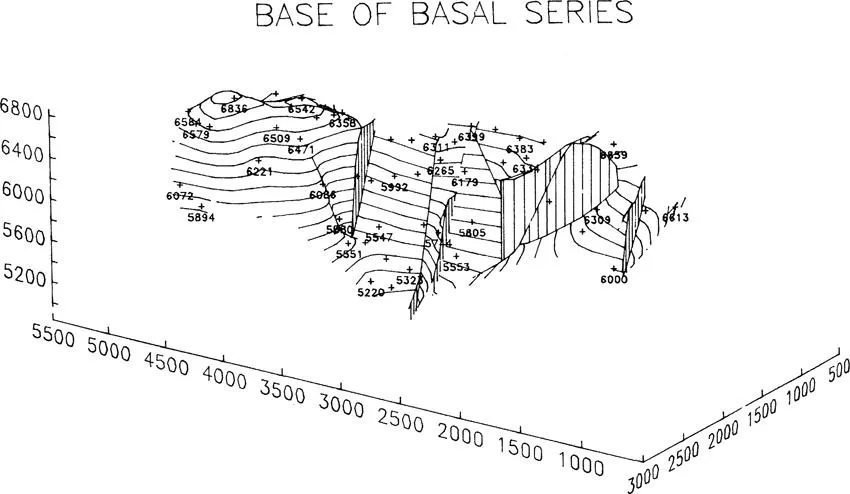
Highly faulted surfaces are very difficult to visualize without the help of a 3D display. In addition to providing a more realistic display, automated 3D techniques allow the user to rotate and change the viewing angle to see all aspects of the subject. The Interactive Surface Modelling (ISM) software produced by Dynamic Graphics produced the complex rendition of subsurface faulting in Figure 1.2. Without a graphic like this, it would be very difficult to understand the nature of this faulted surface.
Combining data sets by draping one over the other is a powerful way to examine the relationships between the two. The most common uses of this technique combine surface and subsurface geologic information with a digital elevation model (DEM). For example, a bedrock geologic map draped over the topography will show the relationships between lithology and landforms, while a combination of a DEM and gravity map will display the local effects of topography on the gravity measurements.
Layers
A series of vertically registered surfaces can be used to represent a portion of the earth’s crust by presenting information on individual subsurface layers. The intervening space can be “filled in” by the viewer. This technique is popular because it displays data in the form often available to geologists, discrete surfaces rather than continuous volumetric data.
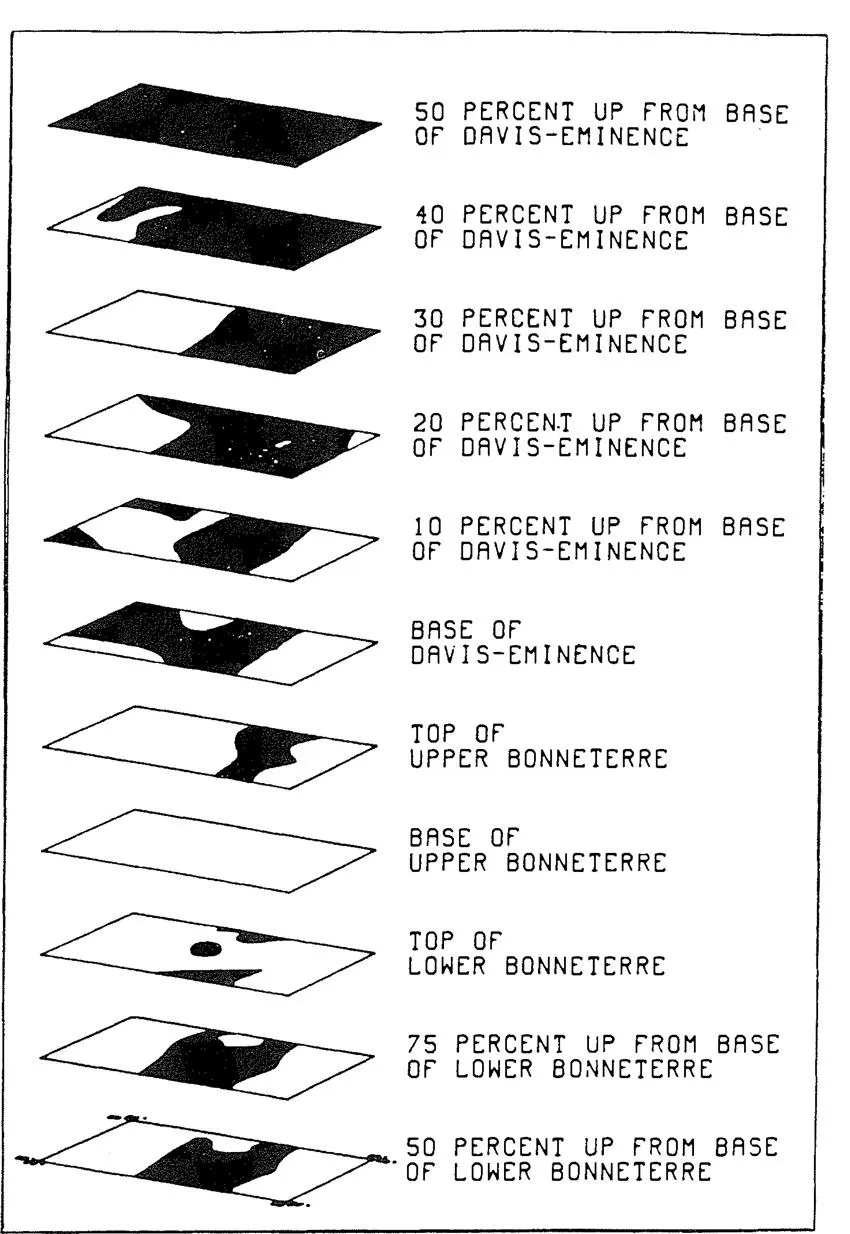
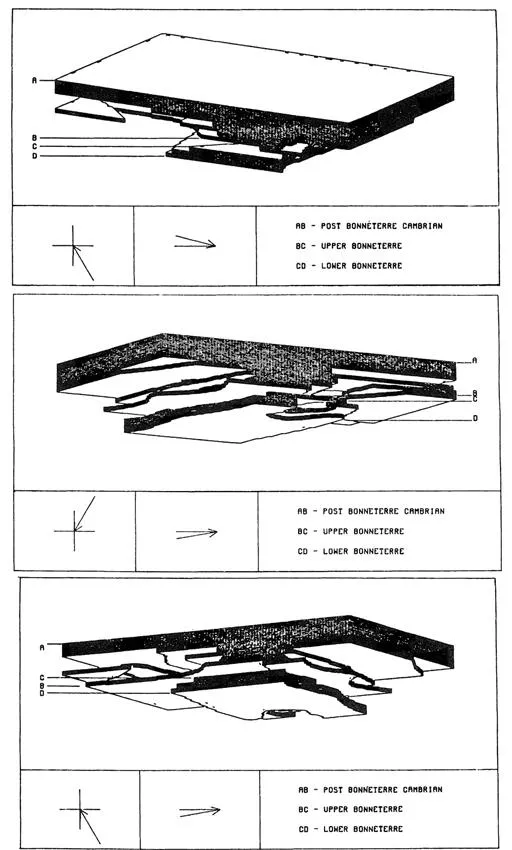
The maps in Figure 1.3 show horizontal slices at 165m intervals through Cambrian rocks in the Springfield, Missouri USGS map sheet quadrangle. Sixteen major lithofacies were identified and mapped as layers using drill core and water well records. The surface area of each map is approximately 100 km by 200 km. The dark areas represent dolomite formed by destructive recrystallization of limestone. The stacked view in Figure 1.4 can be rotated and viewed from any angle or elevation. These displays permit the viewer to see relationships in 3D that are not evident from the source maps. In this example, geologists were able to examine the patterns of recrystallization, and to apply models of depositional environments to understand the depositional history of the region.
The layer technique has been used with excellent results for illustrations in several of the other papers in this volume, including those by Unger et al.
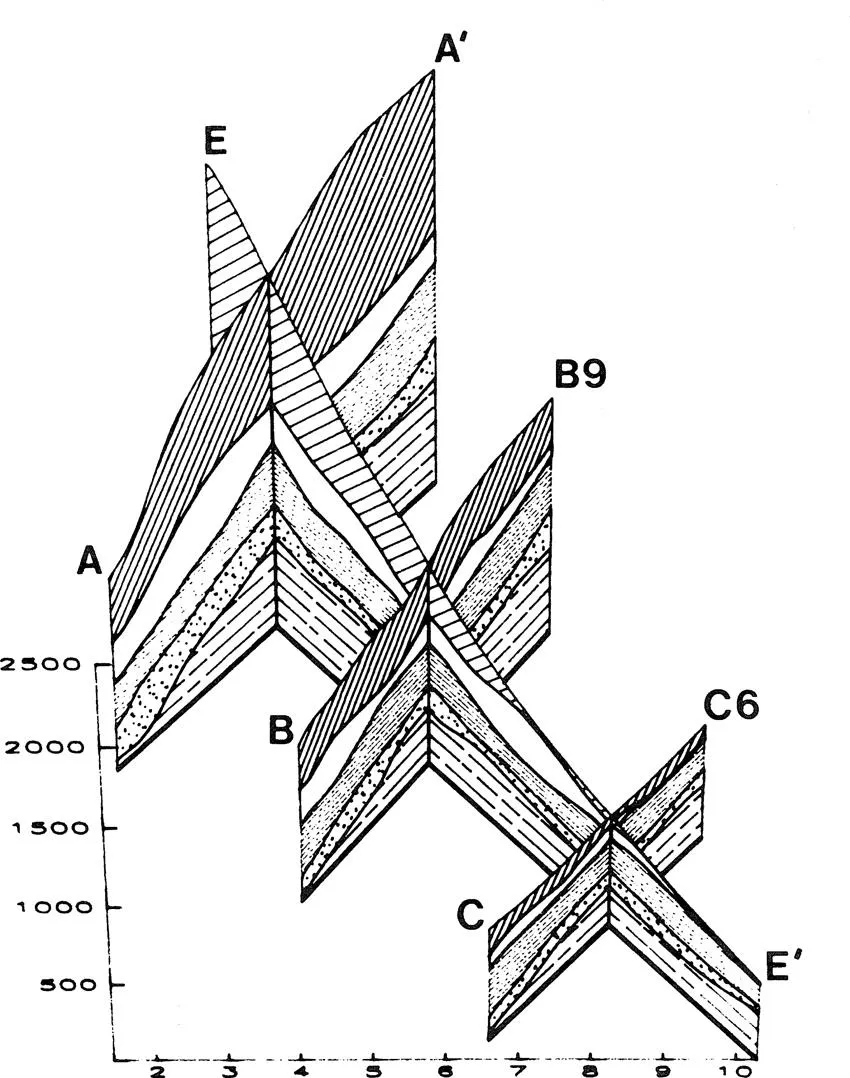
Fence Diagrams
The fence diagram is a classic technique for displaying geologic information in three dimensions. A fence diagram generally consists of boreholes or outcrops connected by cross-sections and presents a display that can be both intuitively appealing and rich in information. In the past, the use of fence diagrams was somewhat limited because of the daunting volume of work connected with their construction. With the computer programs that can now produce fence diagrams, this important display technique is more readily available to geologists.
The examples in Figure 1.5 show the distribution of five geologic units in the San Juan Basin in New Mexico. The viewer can visualize the shapes of these units because the profiles show cross-sections in two axes, and the viewer “connects” the profiles in his mind. Fence diagrams can be especially useful for projects with sparse data points and the requirement to cover large geographic areas.
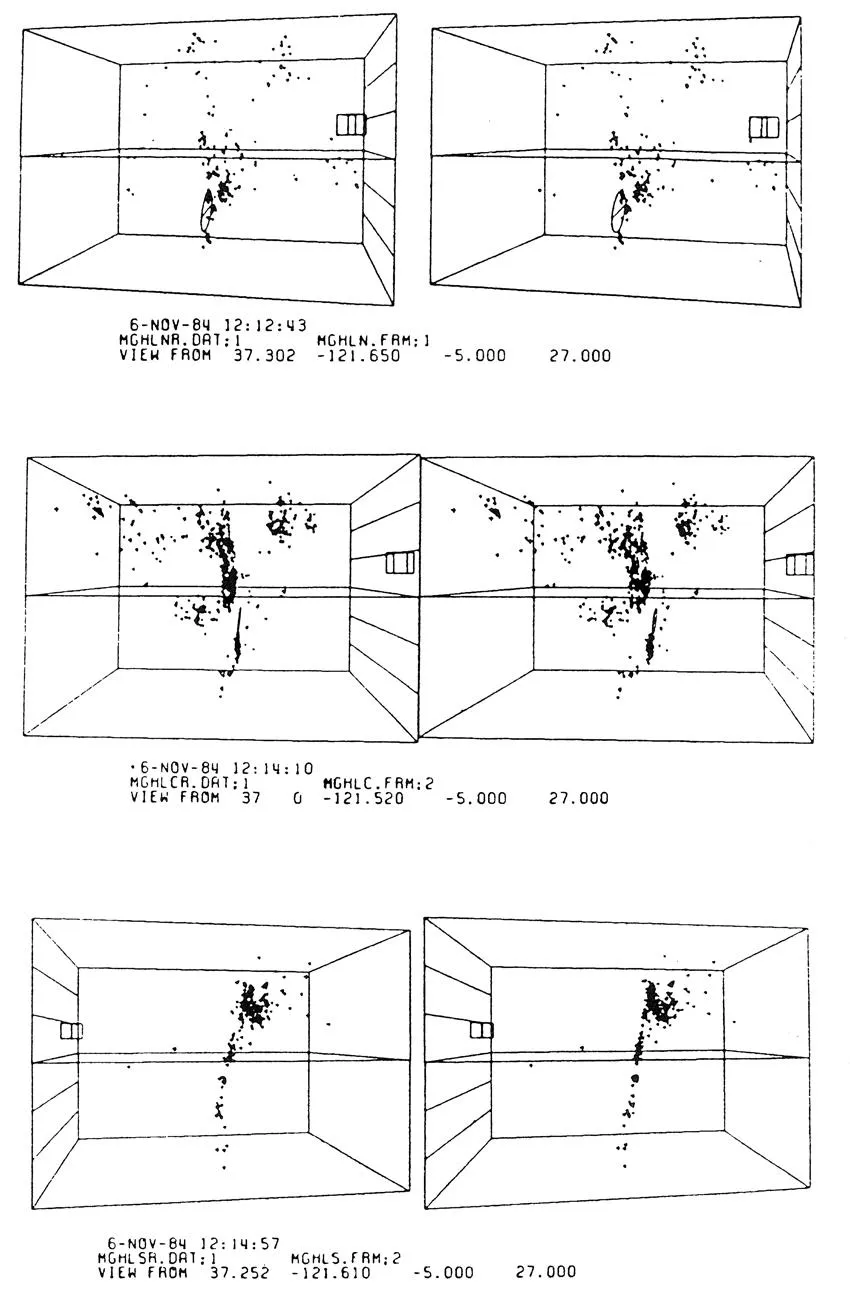
Stereo
Geologists have used stereo views provided by airphotos for many years because stereo provides an excellent representation of the earth’s surface. In many cases, the stereo view is better for mapping because of the vertical exaggeration inherent in the photos. Seismologists in the USGS have developed computer programs to calculate and plot stereo images of earthquake events in the subsurface.
The stereo plots in Figure 1.6 are from the Morgan Hill, California magnitude 6.2 earthquake of 1984. Each cube in the plots is 12 km on a side, with 2 km depth intervals marked on the side. The smaller internal cube is one kilometer on a side and is used for orienting the view. The main earthquake shock is plotted as a circle, and the plusses indicate the aftershocks. The viewer is observing the plot from a depth beneath the surface of 5 km. When these plots are viewed in stereo, the depth of view is excellent. The fault plane is well defined, and can be seen receding into the distance. These plots were made on a Megatek Whizzard system, and show subsurface data in a perspective stereo view.
Hologram
The hologram consists of a thin plastic layer with a molded interference pattern that is covered by another plastic layer. The aluminum acts like a mirror and reflects white light waves through the interference pattern to create the three-dimensional image. This “rainbow hologram” technique has been used as a decorative addition to bank cards, and for illustrations in magazines. USGS seismologists have used rainbow holography to produce a three dimensional image of a 20 degree by 20 degree portion of the earth’s crust showing seismic activity in the Aleutian Islands. The hologram shows the islands on the surface, a three-dimensional grid, and earthquake locations in the subsurface. Although this can be an effective means for communicating 3-D in a printed form, its use is limited because of the expense.
Surface Rendering vs Volume Rendering
The Pixar Image Computer is capable of producing three-dimensional images that show both the surface of an object, and internal details. The surface rendering technique is the equivalent of a hand-drawn block diagram with a map on the top surface and cross-sections on the faces of the block. The volume rendering...