![]()
Chapter 1
Introduction and Examples
1.1 Introduction
This book describes statistical methodology for joint modeling of longitudinal data and time-to-event data. Although our examples focus mostly on biomedical applications, the statistical methods we shall present are applicable to longitudinal follow-up studies in all disciplines. In the area of longitudinal data analysis, joint models were originally developed to address such issues as nonignorable missing data and informative visit times. Missing data are nonignorable when the probability of missingness is related to the missing, unobserved values; otherwise, if the probability of missingness is not related to the missing values, the missing data mechanism is ignorable. Formal definitions of the missing data mechanisms are given in Chapter 2, Section 2.2. Joint models were also studied in the area of time-to-event data analysis for Cox’s (1972) proportional hazards model with time-dependent covariates that are measured intermittently and/or subject to measurement error. In addition, joint models are useful in studies where a repeatedly measured biomarker and a clinical time-to-event outcome are used as co-primary outcome variables to evaluate treatment efficacy.
This chapter introduces several data sets from longitudinal clinical studies that motivate joint analysis and are used to illustrate various modeling approaches in later chapters. All data sets introduced in this chapter are available online at http://publications.biostat.ucla.edu/gangli/jm-book.
1.1.1 Scleroderma Lung Study
The Scleroderma Lung Study, a 13-center double-blind, randomized, placebo-controlled trial sponsored by the National Institutes of Health, was designed to evaluate the effectiveness and safety of oral cyclophosphamide for one year in patients with active, symptomatic scleroderma-related interstitial lung disease [207]. The study was initiated with 158 patients, equally distributed into the two treatment groups and followed for a total of two years. Seventeen patients did not complete the treatment in the first 6 months, so they are excluded from the analysis. By month 24, there were 16 deaths or treatment failures and 47 dropouts. Thirty-seven of the dropouts are considered informative as they were related to patient disease condition. They are referred to as early discontinuation of treatment in the rest of the example.
Table 1.1 Primary variables in the scleroderma lung study.
| Name | Data type |
Primary endpoint | FVC (% predicted) Treatment failure or death | Repeated measurements Time-to-event data |
Baseline covariate | Baseline %FVC Lung fibrosis score Total lung capacity (% predicted) Cough Skin-thickening score | |
Table 1.1 shows the important variables in this study. The primary endpoints of the study are FVC (forced vital capacity, % predicted) and death/failures. The baseline measure of lung fibrosis score is considered as a main confounding factor for patient response to CYC.
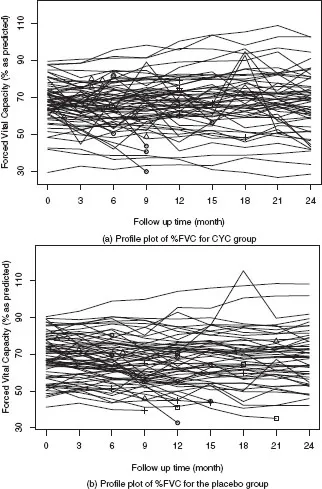
Figure 1.1 shows the profile plot of %FVC by randomization group. There is a large variation in baseline %FVC. We use different symbols to indicate the events that could lead to missing data in %FVC, including treatment failure or death, early discontinuation of the assigned treatment, and noninformatively censored follow up. It seems that treatment failure or death and early discontinuation of the assigned treatment are related to low %FVC scores. As is seen from the missing data patterns summarized in Table 1.2, monotone missing data occurred more frequently in the placebo group. The two types of events, treatment failure or death and early discontinuation of treatment, can be regarded as competing risks and their cumulative incidence functions are shown in Figure 1.2.
The missing data in %FVC could be nonignorable if deaths and failures are correlated with %FVC levels. Some of the dropouts may also be related to %FVC. The analysis using standard approaches such as linear mixed effects models and generalized estimating equations to compare the CYC and placebo groups would lead to biased estimates and invalid inference in the presence of nonignorable missing data. This example presents challenges for the appropriateness of %FVC modeling and evaluation of the intercorrelation between %FVC, death, and dropouts. The data set is used in Chapter 2 to illustrate the analysis of longitudinal measurements assuming ignorable missing data mechanisms, in Example 4.11 to illustrate a joint model that handles both intermittent and monotone nonignorable missing data, and in Example 5.1 for a joint analysis of longitudinal data and competing risks. It is also used to show the application of robust joint models to reduce the impact of outlying %FVC measurements in Chapter 5.
Table 1.2 Summary of completers and non-completers in the scleroderma lung study.
| CYC group | Placebo group |
| Frequency | % | Frequency | % |
Completers | 47 | 68.1% | 42 | 58.3% |
Monotone missingness | 10 | 14.5% | 19 | 26.4% |
Intermittent missingness | 12 | 17.4% | 11 | 15.3% |
1.1.2 Stroke Study: the NINDS rt-PA trial
The National Institute of Neurological Disorders and Stroke (NINDS) rt-PA stroke study is a randomized, double-blind trial of intravenous recombinant tissue plasminogen activator (rt-PA) in patients with acute ischemic stroke (the NINDS rt-PA stroke study group, 1995 [84]). A total of 624 patients were enrolled and randomized to receive either intravenous recombinant t-PA or placebo; there were 312 patients in each treatment arm. Repeated measurements of four outcomes were recorded after randomization: the NIH stroke scale, the Barthel index, the modified Rankin scale, and the Glasgow outcome scale. In particular, the NIH stroke scale is a standardized method to measure the level of impairment in brain function due to stroke, including consciousness, vision, sensation, movement, speech, and language. The score is in the range of 0–42, with a higher value indicating a more severe impairment, and the repeated measurements are available at 2 hours post treatment, 24 hours, 7–10 days, and 3 months poststroke onset. The modified Rankin scale, which is a simplified overall assessment of function, is in an ordinal scale with six levels: no symptoms, no significant disability despite symptoms, slight disability, moderate disability, moderately severe disability, and severe disability. It was recorded at baseline, 7–10 days, 3 months, 6 months, and 12 months poststroke onset.
Figure 1.1
(a)–(b) Profile plots of %FVC for CYC group vs. placebo group: ◦ for treatment failure or death; + for early discontinuation of assigned treatment without %FVC measurements after the events; Δ
for early discontinuation of assigned treatment with %FVC measurements after the events; for noninformatively censored events.There were 25 informative dropouts before 12 months (14 in rt-PA group and 11 in the placebo) and 168 deaths (78 in rt-PA group and 90 in the placebo group, including those who died after 12 months). In addition, we observed 54 treatment failures, of which 17 died later. A treatment failure occurred if the patient remained in severe disability in two consecutive visits after treatment initiation. Table 1.3 summarizes the primary variables in this study. Treatment failure or death and informative dropout are two competing events. Figure 1.3 indicates that treatment failure or death tended to have a higher cumulative incidence rate than dropout in both gro...