
Microeconomics in Context
Neva Goodwin, Jonathan M. Harris, Julie A. Nelson, Pratistha Joshi Rajkarnikar, Brian Roach, Mariano Torras
- 614 pages
- English
- ePUB (adapté aux mobiles)
- Disponible sur iOS et Android
Microeconomics in Context
Neva Goodwin, Jonathan M. Harris, Julie A. Nelson, Pratistha Joshi Rajkarnikar, Brian Roach, Mariano Torras
À propos de ce livre
Microeconomics in Context lays out the principles of microeconomics in a manner that is thorough, up to date, and relevant to students. Like its counterpart, Macroeconomics in Context, the book is uniquely attuned to economic, social, and environmental realities. The "In Context" books offer affordability, accessible presentation, and engaging coverage of current policy issues from economic inequality and global climate change to taxes and globalization.
Key features include:
Clear explanations of basic concepts and analytical tools, with advanced models presented in optional chapter appendices;
Presentation of policy issues in historical, environmental, institutional, social, political, and ethical contexts—an approach that fosters critical evaluation of the standard microeconomic models, such as welfare analysis, labor markets, and market competition;
A powerful graphical presentation of various measures of well-being in the United States and other countries, including income inequality, taxes, educational attainment, and environmental quality;
Broad definitions of well-being using both traditional economic metrics and factors such as environmental quality, health, equity, and political inclusion;
Significantly revised chapters on globalization and trade, economic and social inequality, labor markets, and public goods;
Expanded coverage of high-interest topics such as behavioral economics, labor markets, and economic discrimination;
Full complement of instructor and student support materials online.
This new edition also features more international data and analysis, and further material on the importance of economic power in shaping policy. The latest addition to the "In Context" series combines real-world relevance with a thorough grounding in multiple economic paradigms.
The book's companion website is available at: http://www.bu.edu/eci/education-materials/textbooks/microeconomics-in-context/
Foire aux questions
Informations
Part I
The Context for Economic Analysis
Chapter 0
Microeconomics and Well-Being
- Economic Inequality
- Unequal Income Growth
- Economic Inequality—International Comparisons
- Gender-Based Earnings Inequality
- Educational Attainment
- Taxes as a Percentage of GDP
- Taxes—International Comparisons
- Global International Trade
- Stock Market Performance
- Median Home Prices
- Median Worker Earnings vs. Corporate Profits
- CEO Pay vs. Worker Pay—International Comparisons
- Industrial Concentration Ratios
- Global Carbon Dioxide Emissions
- Per-Capita Carbon Dioxide Emissions—International Comparisons
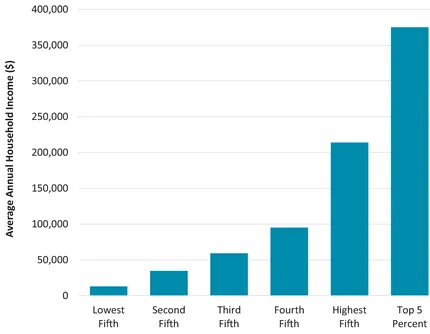
| What it is: | The graph below shows the average household income for different income groups in the United States, based on 2016 data. Each group represents one-fifth of American households, except for the last group which includes only the top 5%. |
| The results: | For American households with income in the bottom fifth, average income in 2016 was only about $13,000. For those in the middle fifth, household income averaged nearly $60,000. Those in the top fifth had an average household income of about $210,000. Average household income was over $375,000 for the top 5%. Note that these are average values, so some households in each group made less than these income values, while some made more. We will discuss income inequality, including its causes, in more detail in Chapter 10. |
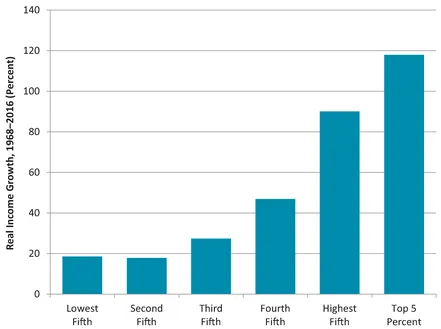
| What it is: | The graph below shows the growth in household income for different income groups in the United States, over the period 1968–2016. Similar to the previous graph, each group represents one-fifth of American households, except for the last group which includes only the top 5%. The data have been adjusted for inflation. |
| The results: | You've probably heard the saying that “The poor get poorer and the rich get richer.” That's close, but not quite true. We see that those at the bottom of the income distribution did see small income gains in recent decades. Those in the middle did a little better. But the largest gains, by far, were obtained by those at the top, particularly those in the top 5%. The graph tells us that income inequality has increased considerably in recent decades. We will discuss trends in income inequality in more detail in Chapter 10. |
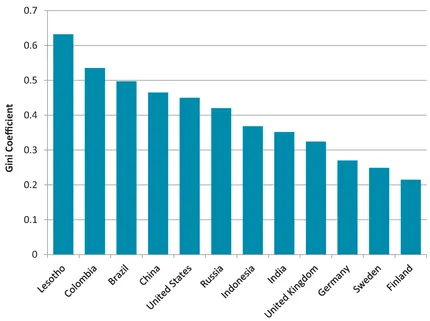
| What it is: | A Gini coefficient is a measure of economic inequality in a country, as we will discuss in Chapter 10. It can range from 0 (everyone in the country has the same income) to 1 (one person receives all the income in a country). |
| The results: | Scandinavian countries such as Sweden, Norway, and Finland tend to be the most equal nations in the world, by income. Other countries with low Gini coefficients include Germany, Hungary, and Ukraine. The United States is the most economically unequal developed country, and has a Gini coefficient similar to Chinas and Mexico's. Several African countries, including Botswana, Lesotho, and South Africa, are the most unequal countries in the world. |
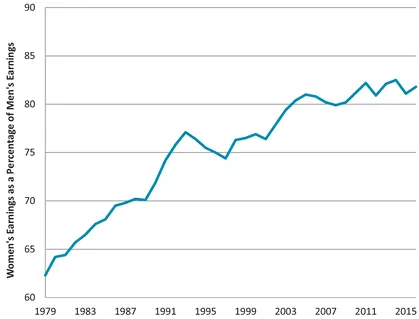
| What it is: | The gender wage gap is the difference in median earnings between men and women who work full-time. The graph below shows women's median earnings in the United States as a percentage of mens median earnings, over the period 1979 to 2016. |
| The results: | In 1979 women working full-time in the United States only earned 62% of what men earned. During the 1970s and 1980s, the gender wage gap closed considerably. By the early 2000s, women working fulltime earned about 80% of what men earned. Since then, the wage gap has remained relatively constant. In 2016, women earned 82% of what men earned. Is this clear evidence of gender discrimination? We'll discuss this topic in more detail in Chapter 9. |
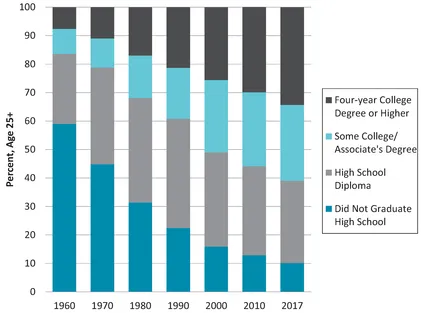
| What it is: | Education is an important type of “human capital”—a term economists use to describe the knowledge and skills people possess that allows them to engage in production activities. The graph below shows the maximum educational attainment for Americans age 25 and over in 1960, 1970, 1980, 1990, 2000, 2010, and 2017. Each column adds up to 100%, but the percent falling into each education category varies with changes in educational attainment. |
| The results: | In 1960, about 58% of Americans age 25 and over had not graduated high school, and less than 10% had a college degree or higher. We see that educational attainment has increased each decade, but still only about 34% of adult Americans have a college degree or higher. We will discuss education as a form of human capital in Chapter 14, and the relationship between education and wages in Chapter 9. |
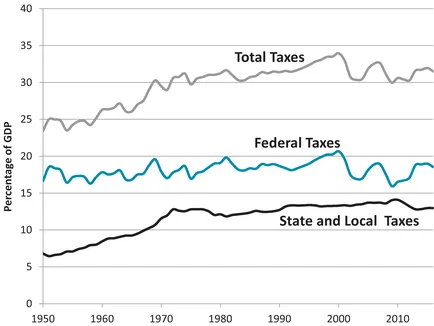
| What it is: | The graph below shows tax collections in the United States over the period 1950–2016, measured as a percent of gross domestic product (GDP). Total taxes are divided into federal taxes and state and local taxes. |
| The results: | Total tax collections in the United States gradually increased from about 25% of GDP in the 1950s to close to 35% of GDP in the late 1990s. Since then, federal tax revenues have fluctuated—falling during recessions and increasing during economic recoveries. While surveys of Americans show that many people believe taxes have gone up in recent years (particularly federal taxes), this is generally not true. We will discuss taxes in more detail in Chapter 11. |
| What it is: | The graph below shows total tax collections in 2015, as a percentage of GDP, for various OECD (Organisation for Economic Co-operation and Development) countries. The OECD is an organization of 36 countries, most of them high-income countries, which promotes policie... |