Advanced Statistics for Physical and Occupational Therapy
Thomas Gus Almonroeder
This is a test
This is a test
Partager le livre
242 pages
English
ePUB (adapté aux mobiles)
Disponible sur iOS et Android
eBook - ePub
Advanced Statistics for Physical and Occupational Therapy
Thomas Gus Almonroeder
Détails du livre
Aperçu du livre
Table des matières
Citations
À propos de ce livre
Advanced Statistics for Physical and Occupational Therapy explains the basis for statistical analyses that are commonly used to answer clinical research questions related to physical and occupational therapy. This textbook provides a resource to help students and faculty in physical and occupational therapy graduate programs understand the basis for common statistical analyses and be able to apply these techniques in their own research. This textbook provides readers with the basis for common statistical analyses, including t -tests, analysis of variance, regression, and nonparametric tests. Each chapter includes step-by-step tutorials with corresponding example data sets explaining how to conduct these statistical analyses using Statistical Package for the Social Sciences (SPSS) software and the Excel Analysis ToolPak, as well as how to identify and interpret relevant output and report results.
Advanced Statistics for Physical and Occupational Therapy is key reading for students in physical therapy, occupational therapy, sport performance, and sport rehabilitation graduate programs as well as students in athletic training courses, applied statistics in sport, and research methods in sport modules.
This new text will also be of interest to practicing clinicians who hope to better understand the research they are reading and/or are interested in starting to conduct their own clinical research.
Foire aux questions
Comment puis-je résilier mon abonnement ?
Il vous suffit de vous rendre dans la section compte dans paramètres et de cliquer sur « Résilier l’abonnement ». C’est aussi simple que cela ! Une fois que vous aurez résilié votre abonnement, il restera actif pour le reste de la période pour laquelle vous avez payé. Découvrez-en plus ici.
Puis-je / comment puis-je télécharger des livres ?
Pour le moment, tous nos livres en format ePub adaptés aux mobiles peuvent être téléchargés via l’application. La plupart de nos PDF sont également disponibles en téléchargement et les autres seront téléchargeables très prochainement. Découvrez-en plus ici.
Quelle est la différence entre les formules tarifaires ?
Les deux abonnements vous donnent un accès complet à la bibliothèque et à toutes les fonctionnalités de Perlego. Les seules différences sont les tarifs ainsi que la période d’abonnement : avec l’abonnement annuel, vous économiserez environ 30 % par rapport à 12 mois d’abonnement mensuel.
Qu’est-ce que Perlego ?
Nous sommes un service d’abonnement à des ouvrages universitaires en ligne, où vous pouvez accéder à toute une bibliothèque pour un prix inférieur à celui d’un seul livre par mois. Avec plus d’un million de livres sur plus de 1 000 sujets, nous avons ce qu’il vous faut ! Découvrez-en plus ici.
Prenez-vous en charge la synthèse vocale ?
Recherchez le symbole Écouter sur votre prochain livre pour voir si vous pouvez l’écouter. L’outil Écouter lit le texte à haute voix pour vous, en surlignant le passage qui est en cours de lecture. Vous pouvez le mettre sur pause, l’accélérer ou le ralentir. Découvrez-en plus ici.
Est-ce que Advanced Statistics for Physical and Occupational Therapy est un PDF/ePUB en ligne ?
Oui, vous pouvez accéder à Advanced Statistics for Physical and Occupational Therapy par Thomas Gus Almonroeder en format PDF et/ou ePUB ainsi qu’à d’autres livres populaires dans Matemáticas et Probabilidad y estadística. Nous disposons de plus d’un million d’ouvrages à découvrir dans notre catalogue.
introduce the general concept of statistical inference
discuss the difference between population parameters and sample statistics
describe, and provide examples of, sampling error
differentiate between independent variables and dependent variables
differentiate between discrete variables and continuous variables
describe the different scales of measurement
discuss the difference between descriptive statistics and inferential statistics
differentiate between parametric statistical tests and non-parametric statistical tests
Introduction
The purpose of this chapter is to introduce a few of the fundamental concepts in statistics and to establish some basic terminology. Don’t expect to see the ‘big picture’ after reading this chapter; we’re just getting started. Each of the basic concepts introduced in this chapter will be revisited at some point in the remainder of this book.
Populations vs. samples
A research study typically begins with a question about a group of individuals. The entire collection of individuals who make up this group of interest is referred to as the population.* For example, imagine that we wanted to examine the effects of a new cartilage regeneration procedure on cartilage thickness in individuals with knee osteoarthritis. In this case, our population of interest would be everyone with knee osteoarthritis.
* Note: populations don’t need to be composed of individuals. For instance, we may be interested in the mechanical properties of a new type of medical implant (population = all medical implants of this type) or the amount of money hospitals spend on medical malpractice insurance (population = all hospitals). That said, I’ll continue to refer to samples/populations as being composed of individuals, since that’s most often the case in clinical research.
In most cases, the purpose of a study is to learn something about a population; however, we rarely have access to the entire population. Therefore, we must rely on sampling. A sample is a subset of individuals from the population of interest. We can use observations from samples to approximate the characteristics, treatment effects, and so on in the corresponding population. This process of drawing conclusions about a population, based on observations made from a sample, is referred to as statistical inference.
As an example, let’s revisit our study examining the effects of the new cartilage regeneration procedure. The optimal way to assess the effectiveness of this new procedure would be to treat and evaluate the entire population of individuals with knee osteoarthritis; however, this certainly isn’t feasible given the large number of people with knee osteoarthritis. Therefore, we would need to sample a subset of individuals with knee osteoarthritis, treat these individuals with the cartilage regeneration procedure, and then examine the changes in cartilage thickness for our sample. Assuming that the individuals in the sample adequately represent the population, we would expect the changes in cartilage thickness for our sample to reflect the changes that would occur in the population (at least to some extent). In this case, we’re making inferences about the effects of a treatment in the population based on the observed effects of the treatment in our sample, which is a common application of statistical inference in medical research.
Defining the population
Defining the population of interest isn’t always as straightforward as it would seem. In some cases, the same groups of individuals could be defined as a sample or a population, depending on whom we plan to generalize our results to.
For example, imagine that you work as part of a quality assurance team for a large healthcare system and that you’re tasked with determining the average wait time for patients who visit your healthcare system’s emergency departments. In this case, you’re not interested in generalizing your findings to patients who visit emergency departments outside of your organization, since your job is just to determine how long patients are waiting when they visit one of your healthcare system’s emergency departments. Therefore, your population would be all visitors to the emergency departments associated with your organization. Now, imagine a different scenario where you’re conducting a study to estimate the average wait time for patients who visit any emergency department across the country. In other words, your goal is to generalize your findings to all emergency department visits. In this case, visits to a single healthcare system would represent a sample from the larger population of visits to all emergency departments. Again, defining the population requires us to consider how we plan to generalize our results.
We also have control over how broadly we define our population(s) of interest. For instance, imagine that we’re conducting a study to examine the effects of a new medication on motor performance in individuals with Parkinson’s disease. As investigators, it would be important for us to clearly identify whom we would like to generalize our results to. In this case, we may decide to target a relatively narrow population of individuals with Parkinson’s disease by establishing a strict list of eligibility requirements. For instance, we could decide to only enroll individuals who are in the early stages of Parkinson’s disease, who are younger than a certain age, and who don’t already take medication to manage their symptoms. In contrast, we may decide to be more broad in how we define our population and include anyone with a medical diagnosis of Parkinson’s disease, regardless of the stage of their disease, their age, or whether they already take medication. A benefit of strictly defining the population of interest is that it helps to limit extraneous factors that may inadvertently influence the results of a study; however, the drawback is that the study findings generalize to fewer people.
Note: establishing eligibility criteria that appropriately define the population (or populations) of interest is more of a study design consideration. However, I think it’s important to highlight whenever discussing populations and samples.
Population parameters vs. sample statistics
A parameter is a value that describes a characteristic of a population, while a statistic is a value that describes a characteristic of a sample. For instance, let’s consider the variable body mass index (BMI) for the population of adult males in the United States. BMI is a metric that reflects an individual’s mass relative to their height squared (kg/m2). The average BMI for all adult males in the United States would be an example of a parameter since it’s derived from all individuals in the population of interest. However, if we found the average BMI for a sample of individuals from the population, this would be a statistic.
In most cases, we work with sample statistics, not population parameters, since we rarely have access to data from the entire population. However, we’re typically interested in the corresponding population parameter, and therefore, we often use sample statistics to estimate unknown population parameters. In other words, we make inferences about population parameters based on observed sample statistics. For instance, we may use the average from a sample to estimate the average for the population.
Sampling error
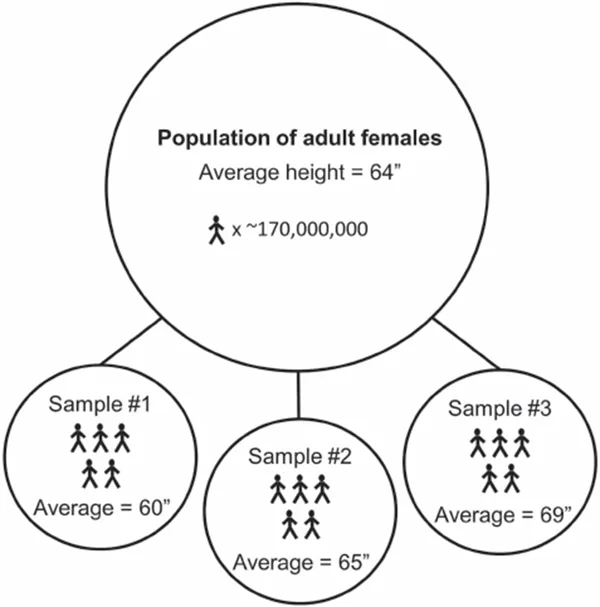
While we typically use sample statistics to estimate population parameters, there will almost always be some degree of error in our estimate, since the individuals in a sample don’t perfectly represent all individuals in the population. The difference between a sample statistic and its corresponding population parameter is referred to as sampling error. Figure 1.1 depicts the concept of sampling error.
It’s important to note that sampling ‘error’ isn’t due to a mistake made by investigators, sloppy data entry, negligence, misconduct, and so on. It’s simply the result of a sample not including every member of the corresponding population. While the extent may vary, all sample statistics include some degree of sampling error.
Throughout this book, you’ll see references made to certain observations occurring ‘by chance alone’. In general, what this means is that the observed effects are simply due to sampling error. For example, imagine that we wanted to compare the reaction times of the populations of men and women. We can’t measure the reaction times of all men and women, so we rely on sampling. Let’s assume that there’s no difference in the reaction times for the populations of men and women. However, imagine that we just happened to sample men with atypically slow reaction times and women with atypically fast reaction times. In this case, we would observe a difference in the average reaction times of the samples of men and women, even though there’s no difference in the populations. This observed difference in the samples is a result of sampling error, not a true difference in the reaction times of the populations. In other words, the observed difference in reaction times between the samples of men and women simply occurred by chance alone.
Figure 1.1Diagram depicting sampling error. For this example, the population is composed of all adult females in the United States (~170,000,000 individuals). The average height for adult females in the population is 64 inches (”). Three different samples of five women are taken from the population. Notice that the average height for each sample differs from the average height of the population because of sampling error. Sample #1 underestimates the height of the population by 4 inches, Sample #2 overestimates the height of the population by 1 inch, and Sample #3 overestimates the height of the population by 5 inches. Also notice that the sample statistics vary from sample to sample, since the samples are composed of different individuals. This is generally referred to as sampling variance.
The concept of sampling error is fundamental to inferential statistics. As a result, we’ll revisit this concept in almost every chapter of this book. The context will change, but the general principle will remain the same. Much of the discussion will involve examining how we can account for sampling error when making statistical inferences.
The influence of sample size on sampling error
In general, statistics derived from relatively large samples will more closely approximate the corresponding population parameter compared to statistics derived from relatively small samples.* In other words, large samples tend to result in less sampling error compared to small samples. This should be fairly intuitive. Basically, the more individuals we include in our sample, the more closely the characteristics of the sample will reflect those of the population. This is why we generally want our samples to be as large as feasibly possible when conducting a study.
* Note: this general phenomenon is explained by a rule known as the law of large numbers.
Independent variables vs. dependent variables
A variable is a characteristic that can take on different values. In other words, a variable can vary. Attributes such as weight, age, sex, disease status, treatment received, and so on are examples of variables since they can vary.
We often delineate between two distinct types of variables: independent variables and dependent variables. An independent variable is a variable that has the potential to influence, or cause a change in, the dependent variable. In the case of an experimental study, the independent variable is the variable that is manipulated by the investigators. In contrast, the dependent variable is the variable that may be influenced by the independent variable. In most cases, the dependent variable is our outcome of interest, since we typically analyze the dependent variable in order to determine whether it was influenced by the independent variable. Basically, the purpose of a study is related to the independent variable(s), while the results of the study are based on the dependent variable.
Note: independent variables are also commonly referred to as ‘factors’.