![]()
1
Financial Archeology
This chapter aims to give the reader a historical background on Foreign Exchange and Interest Rate derivatives in Brazil, through tables, charts and anecdotes.
By studying the past, one can understand why some things are the way they are. If you see a turtle on top of a post, you wonder: “Who put it there?”. Well, in this book there are some turtles not only sitting on top of posts, but they’re juggling chainsaws as well.
Here we’ll show how the most important contracts work, with a formal approach (Richard knows a martingale from a nightingale) and some tinkering with numbers and charts (challenge the first two things Marcos says about something and he might get it right on the third try).
The reader (you, also known throughout the book as “the one”) will learn that, when looking at Brazilian data, it helps to look at events like someone studying dinosaurs: Here a meteor extinguished several species, there the Real Plan extinguished the huge overnight rates. It is quite helpful to break down Brazil’s financial history into periods, and in the differences among strata, distinguish volatility from structural changes.
We’ll also introduce some of the tools used throughout the book, and we encourage the reader to come along this exploration, test our results, and in the process gather knowledge and increase skills in preparation to the next economic plan, change of currency or whatever comes out of Brasilia next.
1.1 Interest rates and inflation
1.1.1 Record levels (the old days of overnight rates of 2% per day and the Real Plan); desperate times call for desperate measures
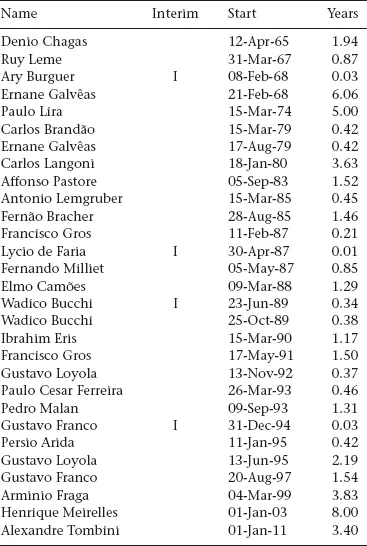
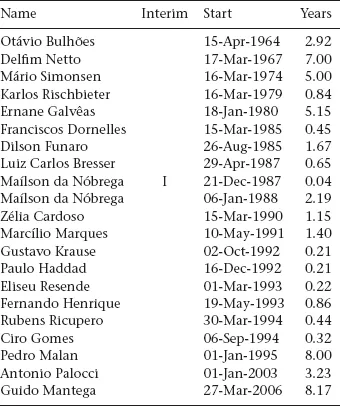
When studying Brazil’s financial history, it’s easy to be amazed by the number (and nature) of events: Here the currency lost 3 zeros, the bank accounts were frozen (the words “bank holidays” carrying an ominous feeling), here comes a new finance minister, there goes another, and so on. Let’s go over the list of the presidents of Brazil’s Central Bank (BCB) (Table 1) and Finance Ministers since 12-Apr-1965 (Table 2) as of mid-2014.
Table 1 Presidents of Brazil’s Central Bank since 1965
The period from Mar-1985 to Jan-1995 saw more than 10 different people commanding the BCB and also more than 10 people with the title of Finance Minister; from 13-Jun-1995 to Jun-2014 we’ve had only 5 BCB Presidents and 3 Finance Ministers.
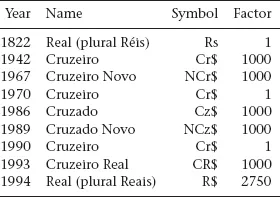
One can see the instability of the period by looking at the currency itself. Named Real (although mostly used in the plural “Réis”) since Portugal discovered Brazil in 1500, and used until 1942, Brazil’s currencies experienced name changes and was divided by 1000 several times, and the last cut (division by 2750 in 01-Jul-1994) brought its name back to Real (Table 3 shows the names and the factors that divided the currency). Twice there was only a name change (Factor=1).
Table 2 Brazil’s Finance Ministers since 1965
Table 3 Brazil’s currencies since 1942
Indeed, the 1985–1995 period experienced 5 name changes and 4 cuts (so 1 Real at 1994 was equal to 2,750,000,000,000 Cruzeiros from 1985). One could say that there’s no sense in a currency that has no cents (the “Centavos” were abolished in 1964 and again in 1984, but life without commas lasted only three and two years, respectively).
Brazil’s hyperinflation will be discussed later; for now let’s remember that those currency conversions will probably be useful later.
We will continue our journey through Brazil’s past at the BCB’s website (http://www.bcb.gov.br/?ENGLISH). Here we can find some interesting time series, while learning some of the formats used throughout the book. The environment configuration: Idiom = English; Date format: European – dd/MM/yyyy (we’ll also use dd-Mmm-yyyy); Number format: American – 123,456,789.00 (although one will likely find the format 123.456.789,00 when importing data from most Brazilian sources).
Fortunately, our curiosity is shared by many others, and the “Ranking” option on the Time Series Management module reveals the most looked up series, which include:
• CDI (the overnight interbank rate for unsecured lending and borrowing) expressed as % per day.
• CDI as % per year.
• Selic (the overnight rate for secured lending and borrowing) as % per year.
• Selic target (the rate determined by the Monetary Policy Committee – COPOM) as % per year.
We’ll use all the data since 1986, and download a CSV file in english (instead of using the website tools), and a quick look reveals that we’ll have to deal with incomplete data.
Now it’s a good time to introduce our approach to data:
• Spreadsheets are useful for looking at some of the data, quick calculations and charts, but we’ll avoid them.
• Ideally results should include the data and the code also, in order to ensure reproducibility.
A good alternative is to use Python (https://www.python.org/), an open-source software that, with the addition of packages like numpy and pandas, provides an environment for scientific, numeric and time-series analysis. If you have to read one book in order to follow our use cases [12] would be perfect.
For those used to Matlab and/or Mathematica, the IPython notebook is a similar experience. Your code (or text) goes into cells, you can get your results just below your commands. Here [13] is the weapon of choice.
After some cleaning (notebook available at the book’s website), we can plot the data to see the history of Brazil’s interest rates.
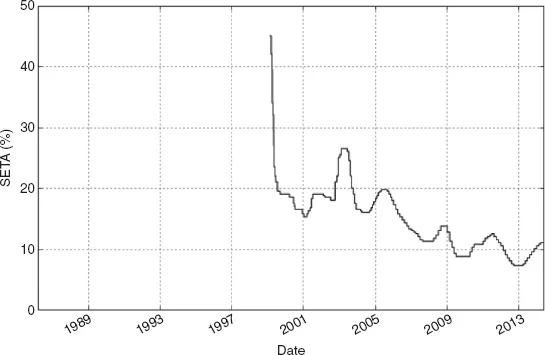
The Selic target rate is available since 1999 (the same year in which Brazil adopted the Inflation Targeting Regime), as shown in Figure 1.
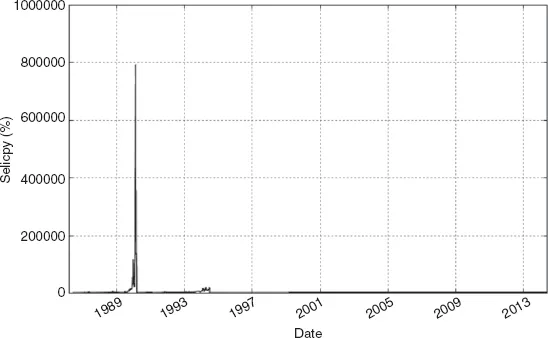
We’ll go back to the period between 1996 and 1999 later to discuss the TBC and the TBAN, but it is worth looking at the Selic rate itself (and its explosive past) in Figure 2.
Figure 1 Selic target
Figure 2 Selic since 1986
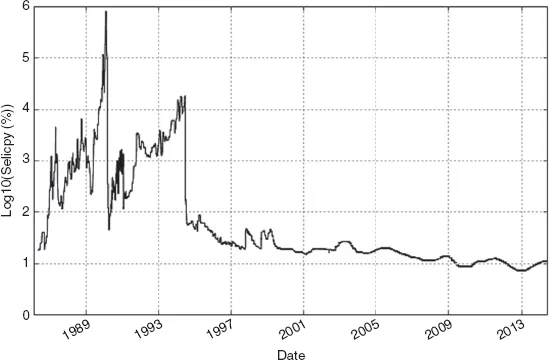
Figure 3 Selic (log scale)
We need to put on some logarithmic glasses to see it better (Figure 3).
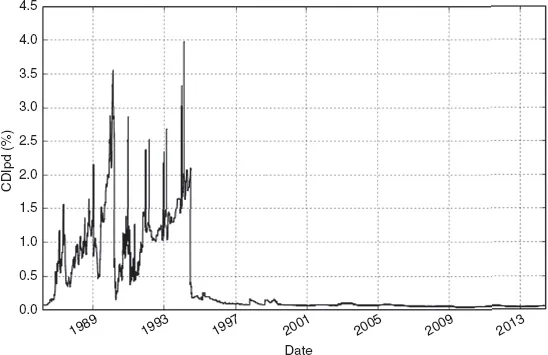
To bring this home, Figure 4 shows the daily CDI rate (2% per day? That will keep real investment away).
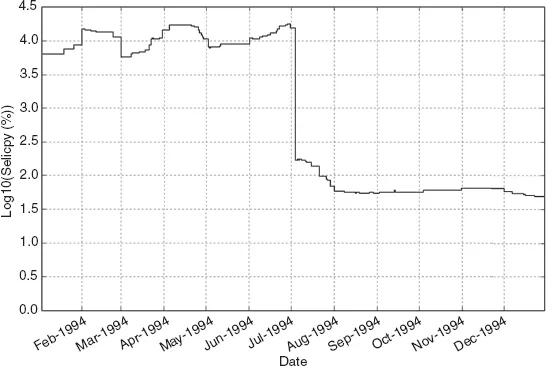
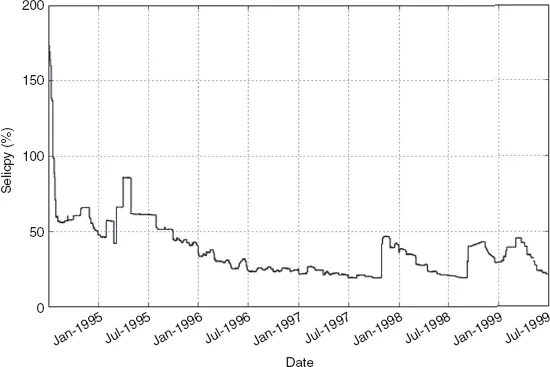
Zooming in (Figures 5 and 6, still in Log10 scale), we can see that the Real Plan (“Plano Real”) succeeded in bringing down interest rates to a lower level (2 digits) quite permanently. As Figure 7 shows, even further increases (Mexican crisis in 1995, EM crisis in 1997, Russia in 1998, the devaluation of the Real in 1999) lasted for a few months and the overnight rates approached lower values (around 20% per year).
Now, one can explain those increases in the overnight rates as a reaction against the possibility of investors taking money out of the country: increase the return, and investors will bear the risk.
Because the level of foreign currency reserves was quite low, this risk was taken quite seriously. Also worth noticing is that the currency was managed from mid-1995 until Jan-1999, and therefore it could not easily devalue as a reaction to shocks: interest rates had to increase a lot.
But after the 1999 devaluation another framework was put in place to determine the overnight Interest Rates, and we will describe these events in Subsection 1.1.2.
Figure 4 CDI (daily rate)
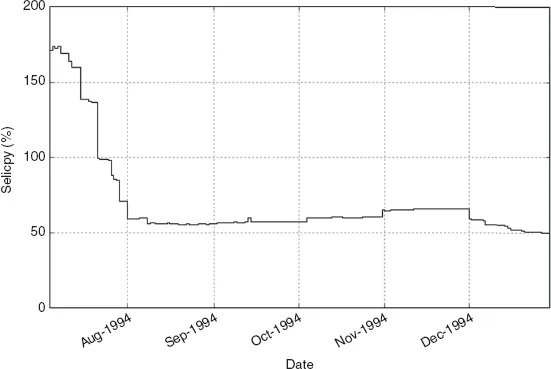
Figure 5 Change in overnight rates with the Real Plan (Jul-1994)
Figure 6 Overnight rates after the Real Plan (1994)
Figure 7 Overnight rates from Jul-1994 to Jul-1999
1.1.2 COPOM (The Brazilian FOMC): behavior, language, influence, targets and bands
From the BCB’s website (http://www.bcb.gov.br/?OBJECTIVES):
“The Central Bank of Brazil’s (BCB) Monetary Policy Committee (COPOM) was created on June 20th 1996, and was assigned the responsibility of setting the stance of monetary policy and the short-term interest rate. The aim in creating the COPOM was to enhance monetary policy transparency and confer adequate regularity to the monetary policy decision-making process.”
There’s a history of interest rates decisions available at http://www.bcb.gov.br/?INTEREST.
We can divide the decisions in four groups.
The first group can be seen as Pre-Inflation Targeting (Table 7), and lasts from 20-Jun-1996 to 04-Mar-1999. It was marked by 3 crises: Emerging Markets in Oct/Nov-1997, Russia/LTCM in Aug/Sep-1998, Brazil’s Devaluation in Jan-1999.
Originally the meeting was held on the second half of the month, and the decisions changed the rates that would be practiced for the following month; but, in response to the market events, sometimes the script was changed. The decision of the 17th meeting was not implemented (an extraordinary meeting held on 30-Oct-1997 increased rates for the following month). And another extraordinary meeting on 10-Sep-1998 increased rates midway through the scheduled duration of the previous decision.
Another interesting aspect of this table is how rates are defined up to 31-Dec-1997: as effective rates for the period. How can we find the values on the table?
Going back to our Selic Time Series, we’ll filter all the rates for the month of Jul-1996 and calculate the overnight discount factors (Figure 8). Therefore the accrual of the Selic for the period is equal to the inverse of the product of the discount factors, matching the result of 1.93%.
Also worth noticing is how rates were expressed. Let’s jump to the website of CETIP (www.cetip.com.br) ...