![]()
CHAPTER 1
Spectroscopic Techniques for the Analysis of Food Quality, Chemistry, and Function
MONALISA MISHRA*a
a Neural Developmental Biology Laboratory, Department of Life Science, NIT Rourkela, Rourkela, Odisha, India, ,
*E-mail:
[email protected] Food is a broad term covering a basic necessity of life. Food regulates our physiological and metabolic activity and hence our health. In the modern era, many transformations have been made to improve the properties of foods, and food colouring and processing have also changed the quality of many foods. These modified foods can also regulate the commencement of many diseases. As a consequence, it is essential to know the chemical and structural composition of foods. Many techniques have been applied to determine the quality of food, and spectroscopy has played a prominent role. This chapter summarizes various spectroscopic techniques that have been used to determine the quality of foodstuffs.
1.1 Introduction
The term ‘food’ is a compound word that is used to describe a material that provides nutritional support to alleviate the hunger of every organism.1 Materials covered by this broad term can be obtained from diverse resources such as plants, animals, and fungi. The food is ingested by different means to meet the physiological needs of a particular animal2 and, according to these needs, the types of food vary from animal to animal. Based on their food habits, animals can be classified as herbivorous, carnivorous, and omnivorous.3 With the continuing advancement of science and technology, the quality of food consumed by humans has improved over time, and consequently surpluses and deficiencies in the amounts or types of food have occurred within the body, causing several metabolic disorders including diabetes. This suggests that food has a determinant role in regulating the physiological and metabolic activity of the organism.
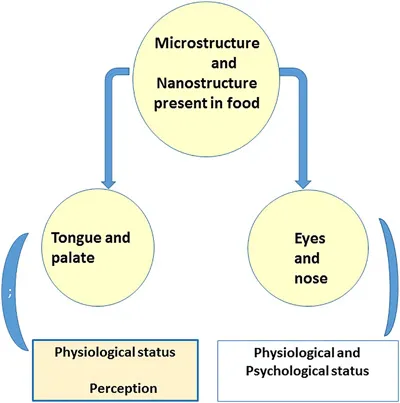
The primary composition of foods includes carbohydrates, proteins, lipids, vitamins, and minerals in different combinations. Phenols, flavones, and colourants are often found as secondary components of food.4 These secondary components help to enhance the aroma and taste of a food by stimulating the sensory organs.5,6 Similarly, the presence of bacteria can alter the metabolic, physiological, and behavioural conditions of humans. Recently, an oroneural connection was established in humans.7,9 Different types of food are also known to improve the psychological condition.10 As a consequence, the determination of food composition, authentication, assessment, prediction, and microbial composition are essential for determining the quality of foods11 (Figure 1.1).
Figure 1.1A mechanistic representation of how the structure of food stimulates the sensory organs.
1.2 Structure and Chemistry in Determining Food Quality
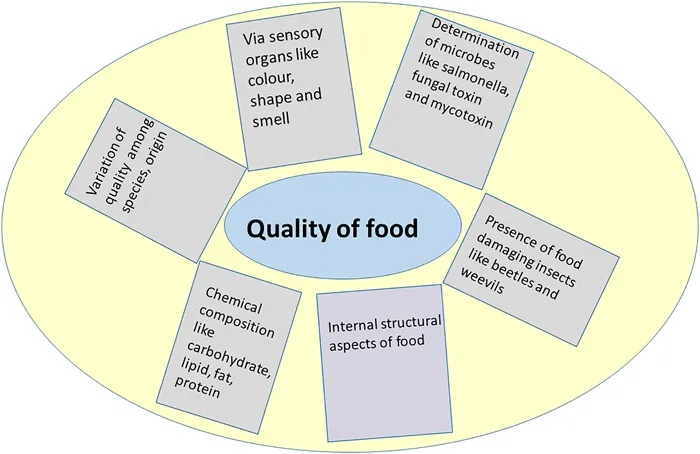
The structure of a food gives an impression of its quality at a first look. The nanostructures present in a food contribute to its colour and shape, which stimulate the sensory organs (Figure 1.2). For example, the actin–myosin complex in meat, starch granules of plant foods, and micelles of milk are nanostructures present within the food. The amorphous and helical region of starch determines the starch quality. Each food has a shelf life, which changes as a function of time. During processing of a food, consideration of the shelf life is important since it has a role in obesity and diabetes. Hence great importance is attached to understanding the structure of foods. Self-assembly of β-lactoglobulin and α-lactalbumin occurs in whey protein. A correlation between the particle size of a food and its effect on the tongue and palate has been described.12
Figure 1.2Factors that affect the quality of food.
In addition to nanostructure, other parameters are also used to detect the quality of food.13 One such parameter is flavonoids, which are low molecular weight polyphenolic substances having a heterocyclic ring (ring C). Flavonoids are resistant to heat, oxygen, humidity, and light. A hydroxyl group on C3 of ring C (flavanol) contributes to the photostability.14 The distribution of flavonoids is species specific for plants. Tea, red wine, fruits, and vegetables are enriched with flavonoids. Although quercetin is the main flavonoid, myricetin, kaempferol, apigenin, and luteolin are also found in foods. Humans need a minimum of 1 g per day of flavonoids for the body.15 The amount of flavanol can be determined from plasma and urine analyses, hence it is often used as a biomarker. External factors such as the season, ripeness, and food preparation and processing can change the amount of flavanol present. A minimum of 10 nM of flavanol is needed in our daily intake of food.16 The amount of quercetin depends on the types of bacteria present in the gut. Flavonoids are conjugated in the liver and are eliminated from the kidney. Flavonoids can be determined using many spectroscopic techniques.17 The matrix of the food is analysed in several industries such as the milk, meat, coffee, and wine trades.18 Although the quality of food can be roughly determined using the sensory organs, many sophisticated types of equipment are also used for this purpose.19
1.3 Spectroscopic Methods for Determining Food Quality
Among numerous techniques, spectroscopy is indispensable for determining the quality of foods.20,24 It is based on the combined action of absorption, transmission, and emission of electromagnetic light radiation with additional materials based on the wavelength of radiation.25 It is an interaction between light and the molecules following the effective collision theory. Light is electromagnetic radiation and the spectra vary according to the wavelength, frequency, and energy.26 It is used as an analytical tool in several branches of science. It can detect the composition of foods, microbes, pest pathogens, and adulteration that occur within the food27,29 (Figure 1.2). Spectroscopic techniques such as UV–visible, fluorescence, infrared, mid-infrared, near-infrared, Raman, and nuclear magnetic resonance spectroscopy are used to determine food quality.
1.3.1 UV–Visible Spectroscopy
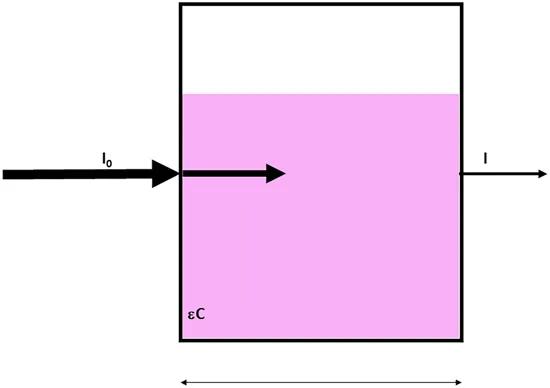
UV–visible spectroscopy is used in several food industries. It is based on the principle of the Beer–Lambert law30 (Figure 1.3):
A = −log(I/I0) = εcl
where I0 is the intensity of the incident light, I is the intensity of the transmitted light, c is the concentration of the sample, l is the pathlength through which the light travels in the sample, and ε is the molar extinction coefficient at a particular wavelength.
Figure 1.3Working principle of UV–visible spectroscopy.
UV–visible spectroscopy uses electromagnetic radiation in the range 100–750 nm. The UV range covers 100–380 nm and the visible range covers 380–750 nm.31 It detects two different aspects: (1) colour and (2) fat oxidation. In oils, the greater the carotenoid (a pigment or chromophore such as chlorophyll, which most plants contain) content, the better is the antioxidant activity.32,35 The presence of chlorophyll makes olive oil bitter.36,37 To determine the fat oxidation, the p-anisidine value (AV) is measured.38 This is the quantity of aldehyde produced during fat oxidation as a function of temperature, oxygen, and light.39 In oils, an AV of >8 is not permissible.
1.3.1.1 In the Oil Industry
UV–visible spectroscopy is widely used to determine the quality of oil by measuring anisidine, which is generated during the oxidation of food. The AV also determines the total oxidation value (Totox), which indicates the fat deterioration.40 The Totox value is represented by two times the peroxide value (PV) plus AV (2PV + AV). It is measured at 350 nm. The deterioration of fat is measured by the PV. When lipids are exposed to heat, daylight, and oxygen, they undergo decomposition and form peroxides and hydroperoxides. The PV value can be measured easily using a UV–visible spectrometer at an absorbance maximum of 240 nm.41 The quality of oil is also determined by the presence of chlorophyll and carotenoids. The greater the amount of carotenoids, the better antioxidant properties the oil has. Carotenoids can be determined at 440 nm42 and chlorophyll at 666 nm. The absorbance peak also varies with the solvent that is used in the analysis. The green colouration of olive oil is due to the presence41 of chlorophyll and pheophytin.43,44 Since pheophytin-α has oxidative properties, the lower its content the better is the oil quality.44
1.3.2 Fluorescence Spectroscopy
The application of fluorescence spectroscopy is a rapid means to analyse a sample in a non-destructive way. It detects the fluorescence based on a naturally present fluorophore within the sample.45 Many microbes and their colonies possess fluorescence, hence it is easy to detect the presence of any microbes based on their fluorescence spectra.46,47 Many foods possess fluorophores. There is also a chance that food may become contaminated due to the presence of microbes. Since foods contain fluorophores, many industries use the fluorescence technique to determine food quality. The method is based on the emission of light after absorption of ultraviolet or visible light by a fluorophore.48,4...