![]()
High growth and development have always been conceived as processes linked to industrialization. In the context of developing countries, while the vision of ‘catching up’ is largely drawn on images of advanced countries, the trajectory had historically proven to be different. The expansion of industries in developing countries, especially manufacturing, has never followed a smooth trajectory, normally involving enclaves of growth that later diffuse to a more dispersed process of industrialization. In a limited sense development is conceived as a process by which increasing proportions of the population become involved in increasing returns activities, especially manufacturing. This is primarily because it is assumed that creating opportunities to work in higher value adding jobs necessarily leads to higher individual income and consumption, and subsequently a rising spiral of social welfare. This draws our attention to the larger issue of the nature of growth in India in the recent past, which has undoubtedly been unprecedented but hardly approximates an inclusive pattern of growth. The inclusion of the majority of people in sharing the fruits of high growth involves several issues and is obviously linked to transcending the various dimensions of exclusion underway. In addition to rising unemployment and poverty, deprivations manifest in discrimination by class, caste and gender. Reforms have largely activated the levers of the market and that has undoubtedly geared businesses that respond to market signals, but in countries such as India for a large mass of people the same levers turn out to be exclusionary since a vast section of the population lag the requisite capacity to participate in the market. As a result the relevance and necessity of public provisioning of certain key services such as food, health, education and so on becomes important. But decisions regarding such provisioning and distribution are also largely influenced by the discriminatory structure that fosters such inequalities and deprivation. These issues have been addressed by the planners, and the goals set accordingly under the broad rubric of inclusive growth.
The term ‘inclusive growth’ includes several economic and social dimensions of inclusion. However the scope of this book is limited to addressing a specific aspect of inclusion; that is, conceiving of a growth process that increases gainful employment. In countries such as India, the majority of the people have no assets other than their labor power against which they can earn a living, and therefore the eradication of poverty and deprivation is essentially linked to creating gainful employment. But the issue at hand is to create such employment that effectively means that an employed person’s marginal value product of labor should be greater than the subsistence wage. There are enough reasons to believe that this can be achieved in agricultural activities as well by increasing productivity through the introduction of technologies, but since it is relatively harder to escape the limitations of decreasing returns in the production of food and livestock, so it is generally held that faster growth in per capita value added requires faster growth in manufacturing activities. The role of the manufacturing sector in prompting higher growth was captured in Kaldor’s first law, which states that the faster the rate of growth of manufacturing in the economy, the faster will be its growth of GDP.1 And this is not simply manifesting a correlation, but a strict causality flowing from growth in manufacturing to growth in GDP. There exist conflicting views on whether services can play the role of an ‘alternative engine’ or that of an ‘additional engine’ of growth or not, nevertheless, empirical evidence comparing the growth of two of the fastest growing developing countries – India and China – emphasizes the importance of manufacturing in achieving sustained growth. Moreover, recent trends in global industrial development indicate that the growth of developing countries in the global share of manufacturing value added is linked to faster growth and a rise in exports therein. As a result, policies need to promote manufacturing activities, both the final products and the tasks that could be linked to global value chains. The size of the domestic market remains a critical determinant of the export target of a specific country, but avenues of export might also be used to employ the surplus labor available in most of the developing countries.
In this context what becomes important is the declining significance of large scale enterprises, both in terms of meeting export demands as well as employment generation. Rising capital intensity in organized manufacturing did not give rise to a commensurate growth in labor productivities, but of course resulted in declining employment elasticities (Roy 2012). Moreover the size of a specific enterprise in the production structure no longer determines the scale of operation, and in many instances vertically integrated large firms might prove to be inefficient, given the size of the market and the kind of flexibility required. The dynamics of geography in production and the spatial nature of specialization have largely pushed the scalar dimension of production to the back seat. A city as a whole might be housing a large number of horizontally linked firms of different sizes involved in the production of a specific good or task for the global market. In that case vertical integration does not make as much sense as in the past. Firms of varying size are assigned a standardized task in the international division of labor, and it is the inter- firm relationship that largely determines the scope of growth of such agglomerations. This evolving pattern obviously provides greater scope for small and medium enterprises in the growth process. Furthermore in labor intensive sectors, the organic agglomeration of firms or clusters can be conceived as one of the major vehicles of promoting inclusive growth.
In this chapter we focus on three broad perspectives that drive our interest for a re- evaluation of the process of industrialization. The following section briefly analyzes the structural disconnect between growth and gainful employment in India over the past two decades. The next section emphasizes the broad trends in global manufacturing and the growing participation of developing countries; the third acknowledges the necessity of considering industrial clusters as the new unit of analysis and their role in industrial development; finally we briefly describe the plan of the chapters that follow.
Trends in growth and employment in India
Indian economy has demonstrated high levels of growth and per capita income in recent years, accompanied by an unprecedented shift of population from agriculture to non- agriculture during the last decade. India’s real national income grew by 125 percent during the economic reform period of 1992/93–2005/06 compared to 97 percent during the preceding period of the same duration. Consequently the per capita income increased by 77 percent during the same reference years of high growth. However the entire growth process did not result in rising gainful employment. In course of identifying goals for inclusive growth, the approach paper for the eleventh plan fixed a target of creating 65 million additional non- agricultural employment opportunities during the plan period that could accommodate the shift in employment from agriculture to non- agriculture required for targeting faster growth (Planning Commission, GOI 2006).
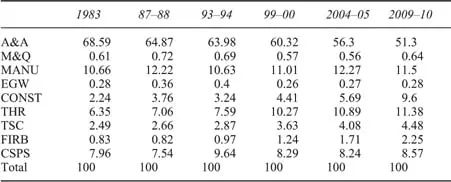
High growth in India was accompanied by a structural change in employment, that is, a marked shift of employment from agriculture to non- agricultural activities, nevertheless, growth of non- agricultural employment does not necessarily mean a rise in gainful employment (Roy 2008). Table 1.1 shows the distribution of usually employed persons (principal and subsidiary)2 for successive rounds of the National Sample Survey (NSS). There has been a sharp decline in the share of employment in agriculture during the past three decades. The share of the agriculture and allied sector has come down from 68.59 in 1983 to 51.3 in 2009–10, showing a decline of about 17 percentage points during the reference period.
This shift in employment away from agriculture and allied activities was absorbed at varying degrees by different industry groups in non- agriculture; the major absorbers being construction; trade, hotels and restaurants; transport, storage and communication; finance, insurance, real estate and business activities. The share more than doubled in the case of the construction and service industries like finance and business services, and nearly doubled in the cases of transport, storage and communications and trade, hotels and restaurants. In the case of manufacturing the share increased but did not show a significant rise.
We will now briefly discuss how the shift in employment to various sectors is linked to growth in output and investment in respective sectors as well as to relative shares in output.
Table 1.1 Distribution of employment (UPSS) by industry categories over the years
Source: Papola and Sahu (2012).
Notes
A&A = Agriculture and allied, M&Q = Mining and quarrying, MANU = Manufacturing, EGW = Electricity, gas and water supply, CONST = Construction, THR = Trade, hotels and restaurants, TSC = Transport, storage and communication, FIRB = Financing, insurance, real estate and business services, CSPS = Community, social and personal services.
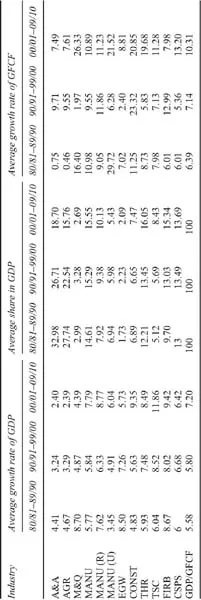
Table 1.2 shows the average growth rate in output, average share in GDP at constant prices and average growth rate of gross fixed capital formation (GFCF ) at constant prices by industry categories, computed over three consecutive periods from National Accounts Statistics: 1980/81 to 1989/90, 1990/91 to 1999/2000 and 2000/01 to 2009/10.The sharp decline in the share of employment in the agriculture and allied sector has also been associated with a decline both in the average growth of output and the average share in GDP at constant prices in the three successive periods. The average growth of GFCF in this sector, however, increased from 0.75 percent in the 1980s to 9.71 percent in the 1990s and then declined to 7.49 percent during the current decade. Sectors gaining in the share of employment during the reference period such as construction and trade hotels and restaurants recorded a more or less consistent rise in all the three parameters, although in the case of construction the share of GDP slightly dipped in the second period and the growth of GFCF slightly declined in the third period. In the case of transport, storage and communications, both the average growth of output and the average share in GDP at constant prices increased in the three successive periods; however, this sector registered a marginal decline in the growth of GFCF in the second reference period. The other sector in which the share in employment increased significantly is finance, insurance, real estate and business services. In this sector the average growth of GDP declined during the 1990s, although the sector gained in terms of share in GDP. There has been a sharp decline in the growth of GFCF from 12.99 percent to 7.98 during the third reference period. In the manufacturing sector there has been a decline in the growth rate in registered manufacturing during the 1990s; however, it picked up slightly during the successive period. In the case of unregistered manufacturing, the growth of output increased from 3.45 percent to 4.91
Table 1.2 Average growth of GDP, GFCF and average share in GDP at constant 2004–05 prices
Source: Computed from National Accounts Statistics, back series and various years (CSO).
Notes
AGR = Agriculture; MANU (R) = Manufacturing (registered); MANU (U) = Manufacturing (unregistered); others same as Table 1.1.
percent and then further to 6.04 percent in the three successive periods; however, the share in GDP showed a consistent decline.
At a more disaggregated level the increase in the average growth rate is highest in the case of communications, which picked up from 5.88 percent during the 1980s to 14.44 percent in the 1990s and 24.82 percent during the first decade of this millennium. In terms of share in GDP, the decline in the case of agriculture was quite sharp, in the last decade it came down from 22.54 percent to 15.76 percent. The sectors that registered a drastic decline in the growth of investments in the first two periods are mining and quarrying, and unregistered manufacturing, and comparing the second and third reference periods banking and insurance showed a sharp decline in growth in investments. Hence, it might appear that the share in employment, average growth of output, average share in GDP and average growth in investments moved more or less in the same direction, although this might not be the case in all the sectors.
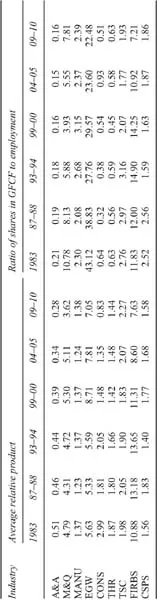
In order to comprehend the causality between the sectoral shifts in employment, output and investments we further examine the average relative product, i.e. the share in GDP divided by share in employment in the respective sectors, and also the share in GFCF divided by share in employment.3 Table 1.3 shows the relative changes in output and investment for various industry groups with respect to employment.
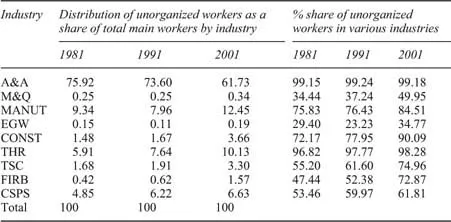
The sectors in which the share in employment increased are also the sectors in which relative product per worker and share in GFCF with respect to employment have declined sharply (Table 1.3). These are construction; trade, hotels and restaurants; transport, storage and communication; and financial services. This implies that the increase in the share of employment in various sectors has not been accompanied by an increase in the average relative product, and is not being caused by a relative increase in the share of investments in respective sectors. This is further refected by the increase in the unorganized component in the labor force employed in different sectors. Table 1.4 shows that the expansion in the relative share in employment in different sectors is also accompanied by a sharp increase in the share of unorganized workers in respective sectors, and also in terms of rise in the share of unorganized workers within industry groups. The relative share in unorganized workers for the construction sector; trade, hotels and restaurants; transport, storage and communication; and financial and business services more than doubled during the reference period.4 The share of unorganized workers in total employment in the manufacturing sector was almost unchanged, that is 75.83 percent in 1981 and 76.43 percent in 1991; however it increased to 84.51 percent in 2001. The same share for the construction sector increased from 72.17 percent to 77.95 percent and further to 90.09 percent during the same reference periods.
In 2001, the share of unorganized workers in the trade, hotels and restaurants; transport, storage and communication; and financial and business services went to 98.28 percent, 74.96 percent and 72.87 percent respectively.
Thus the structural change in employment in India over the last three decades reveals the following facts: (1) A significant shift in employment has occurred
Table 1.3 Average relative product and ratio of shares in GFCF to employment by industry categories
Note
Industry abbreviations as for Table 1.1.
Table 1.4 Distribution of unorganized workers as a share of total main workers by industry and by industry categories
Source: Computed from census data and economic survey 2005/06.
Note
Industry abbreviations as for Table 1.1.
from agriculture to non- agricultural sectors, the major destinations of employment being construction; wholesale and retail trade; transport related activities; and financial and business services. (2) An increase in the share of employment has not been caused by an increase in the relative share in investments and did not result in higher levels of relative product per worker either. (3) Those sectors that contributed to the growth of employment are also the sectors where the share of unorganized workers increased sharply.
Trends in global manufacturing
The declining trend in global manufacturing value added has been accompanied by a marked shift in the location of manufacturing from developed to developing countries. The annual growth of global manufacturing value added slowed from 4.3 percent between 1995 and 2000 to 2.6 percent between 2000 and 2005. The growth of manufacturing value added in industrialized countries decelerated to virtual stagnation, growing at only 1.1 percent in 2000–05, compared with 3.7 percent in ...