Learn QGIS
eBook - ePub

Learn QGIS

Your step-by-step guide to the fundamental of QGIS 3.4, 4th Edition

Andrew Cutts, Anita Graser

Partager le livre
  1. 272 pages
  2. English
  3. ePUB (adapté aux mobiles)
  4. Disponible sur iOS et Android
eBook - ePub

Learn QGIS

Your step-by-step guide to the fundamental of QGIS 3.4, 4th Edition

Andrew Cutts, Anita Graser

DĂ©tails du livre
Aperçu du livre
Table des matiĂšres
Citations

À propos de ce livre

Learn to view, edit and analyse geospatial data using QGIS and Python 3

Key Features

  • Leverage the power of QGIS to add professionalism to your maps
  • Explore and work with the newly released features like Python 3, GeoPackage, 3D views, Print layouts in QGIS 3.4
  • Build your own plugins and customize maps using QT designer

Book Description

QGIS 3.4 is the first LTR (long term release) of QGIS version 3. This is a giant leap forward for the project with tons of new features and impactful changes. Learn QGIS is fully updated for QGIS 3.4, covering its processing engine update, Python 3 de-facto coding environment, and the GeoPackage format.

This book will help you get started on your QGIS journey, guiding you to develop your own processing pathway. You will explore the user interface, loading your data, editing, and then creating data. QGIS often surprises new users with its mapping capabilities; you will discover how easily you can style and create your first map. But that's not all! In the final part of the book, you'll learn about spatial analysis and the powerful tools in QGIS, and conclude by looking at Python processing options.

By the end of the book, you will have become proficient in geospatial analysis using QGIS and Python.

What you will learn

  • Explore various ways to load data into QGIS
  • Understand how to style data and present it in a map
  • Create maps and explore ways to expand them
  • Get acquainted with the new processing toolbox in QGIS 3.4
  • Manipulate your geospatial data and gain quality insights
  • Understand how to customize QGIS 3.4
  • Work with QGIS 3.4 in 3D

Who this book is for

If you are a developer or consultant familiar with the basic functions and processes of GIS and want to learn how to use QGIS to analyze geospatial data and create rich mapping applications, this book is for you. You'll also find this book useful if you're new to QGIS and wish to grasp its fundamentals

Foire aux questions

Comment puis-je résilier mon abonnement ?
Il vous suffit de vous rendre dans la section compte dans paramĂštres et de cliquer sur « RĂ©silier l’abonnement ». C’est aussi simple que cela ! Une fois que vous aurez rĂ©siliĂ© votre abonnement, il restera actif pour le reste de la pĂ©riode pour laquelle vous avez payĂ©. DĂ©couvrez-en plus ici.
Puis-je / comment puis-je télécharger des livres ?
Pour le moment, tous nos livres en format ePub adaptĂ©s aux mobiles peuvent ĂȘtre tĂ©lĂ©chargĂ©s via l’application. La plupart de nos PDF sont Ă©galement disponibles en tĂ©lĂ©chargement et les autres seront tĂ©lĂ©chargeables trĂšs prochainement. DĂ©couvrez-en plus ici.
Quelle est la différence entre les formules tarifaires ?
Les deux abonnements vous donnent un accĂšs complet Ă  la bibliothĂšque et Ă  toutes les fonctionnalitĂ©s de Perlego. Les seules diffĂ©rences sont les tarifs ainsi que la pĂ©riode d’abonnement : avec l’abonnement annuel, vous Ă©conomiserez environ 30 % par rapport Ă  12 mois d’abonnement mensuel.
Qu’est-ce que Perlego ?
Nous sommes un service d’abonnement Ă  des ouvrages universitaires en ligne, oĂč vous pouvez accĂ©der Ă  toute une bibliothĂšque pour un prix infĂ©rieur Ă  celui d’un seul livre par mois. Avec plus d’un million de livres sur plus de 1 000 sujets, nous avons ce qu’il vous faut ! DĂ©couvrez-en plus ici.
Prenez-vous en charge la synthÚse vocale ?
Recherchez le symbole Écouter sur votre prochain livre pour voir si vous pouvez l’écouter. L’outil Écouter lit le texte Ă  haute voix pour vous, en surlignant le passage qui est en cours de lecture. Vous pouvez le mettre sur pause, l’accĂ©lĂ©rer ou le ralentir. DĂ©couvrez-en plus ici.
Est-ce que Learn QGIS est un PDF/ePUB en ligne ?
Oui, vous pouvez accĂ©der Ă  Learn QGIS par Andrew Cutts, Anita Graser en format PDF et/ou ePUB ainsi qu’à d’autres livres populaires dans Computer Science et Data Visualisation. Nous disposons de plus d’un million d’ouvrages Ă  dĂ©couvrir dans notre catalogue.

Informations

Année
2018
ISBN
9781788998864
Édition
4

Data Creation and Editing

At the core of any GIS is data. Without it, we cannot create maps or perform spatial analysis. In this chapter, we will load, edit, and create data. We will look at the large range of formats and types and how QGIS 3.4 helps us to work with them.
If you are familiar with GIS, then you will already know that we often work with vector data, namely points, lines, polygons, and raster data, as pixels. Vector and raster data are the core data types that we use in a GIS. However, text files, databases, and web services can also be integrated into GIS. We can use a location associated with a file (such as a coordinate), or we can perform joins to extend or spatially enable our existing data.
In this chapter, we will explore all of the data options in QGIS. The topics covered in this chapter are as follows:
  • Data formats
  • Loading data
  • Interacting with data
  • Vector data
  • Attributes
  • Editing and creating data
  • Data joins
  • Raster data
  • Other data in spatial databases

Data formats

QGIS supports many GIS data formats. It makes use of the OGR library for vector data and the GDAL library for raster data.
To see the latest list of OGR vector formats, check out http://www.gdal.org/ogr_formats.html, and to see a list of GDAL raster formats, visit http://www.gdal.org/formats_list.html. If you can't find your format on the list, it is probably not supported in QGIS at this time.
Shapefiles are the most common form of vector data today, and QGIS supports this format. Similarly, GeoTIFF are probably the most common form of raster data, and QGIS also supports these. In this book, we will work with and use these formats, as well as the new GeoPackage format.

GeoPackage

QGIS 3 has chosen GeoPackage as its default format. This is an open format, unlike the Shapefile, which is proprietary. GeoPackage also supports rasters. It is built on a SpatiaLite database, has no file size limitations, and works as one file. The format was developed by the Open Geospatial Consortium and is increasingly being adopted by organizations around the world. A GeoPackage has a .gpkg extension, which unlike the Shapefile has several extensions.

Loading data

We are going to start by loading data into QGIS 3.4. You may have some of your own data that you wish to use, but all of the techniques are applicable to any GIS data you have. We will use the QGIS sample data for these examples. Over the following chapters, we will use the sample dataset to eventually build maps.
Download the QGIS sample data from https://qgis.org/downloads/data/ and look for the qgis_sample_data.zip file. Download and extract this data to a folder on your computer.

Getting data into QGIS

Loading data into QGIS can be done in several ways. The three most common ways are as follows:
  • You can drag data directly from a folder straight into the map.
  • You can drag data from the browser panel (shown in Chapter 1, Where Do I Start?) onto the map.
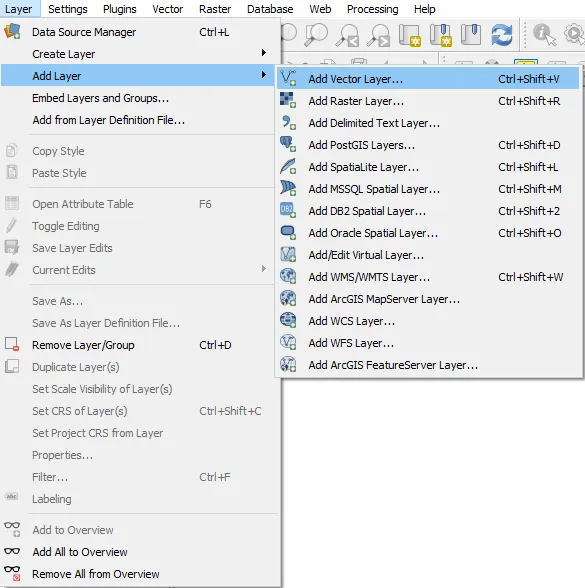
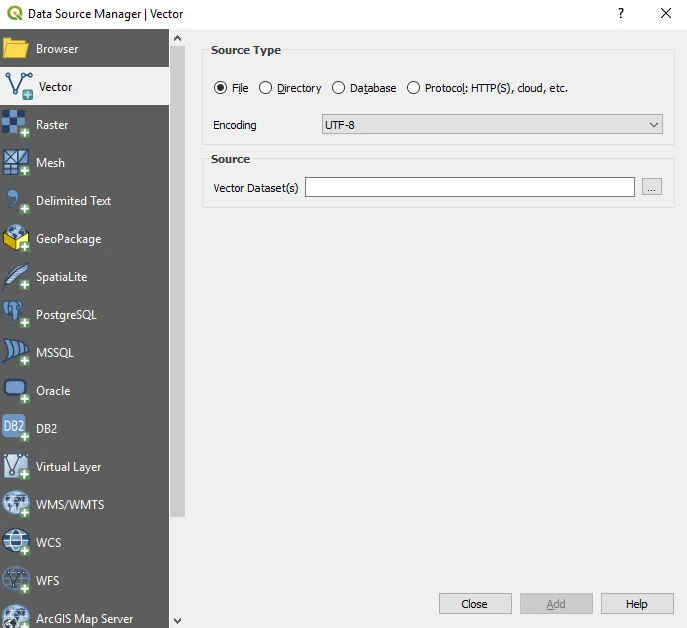
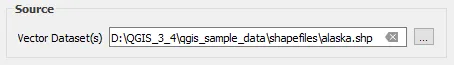
  • You can click Layer | Add Layer and choose what type of layer to add.
In the following screenshot, we are choosing to load a Vector Layer, which can also be done using the Ctrl + Shift + V shortcut:
Adding a vector layer
By choosing this method, the Data Source Manager window will appear, with Vector highlighted, as follows:
The QGIS Data Source Manager
Click on the ellipsis for Vector Dataset(s) and navigate to the layer you wish to load. In the following example, the alaska Shapefile is selected. You can load more than one layer at the same time by holding down the Ctrl button and clicking on multiple files:
Loading data in the data source manager
If you then click the Add button at the bottom of the Data Source Manager window, the data will be added to your Map window as well as the Layers window. The Data Source Manager window will remain open, and you can also load other layers. Close the window and your Shapefile will appear in the map, as follows:
Data loaded into the map panel in QGIS
In the next section, we will look at how to interact with the data to zoom in and inspect its attributes.
2323_...

Table des matiĂšres