
eBook - ePub
Metabolomics and Systems Biology in Human Health and Medicine
Oliver Jones, Oliver Jones
This is a test
- English
- ePUB (adapté aux mobiles)
- Disponible sur iOS et Android
eBook - ePub
Metabolomics and Systems Biology in Human Health and Medicine
Oliver Jones, Oliver Jones
Détails du livre
Aperçu du livre
Table des matières
Citations
À propos de ce livre
The metabolomics and systems biology approach to research can be applied to many disciplines. This book provides a solid introduction to medical metabolomics and systems biology, and demonstrates how they have been applied to studies in medicine and human health, including nutrition and pathogenic microorganisms. Following core themes of diagnosis, pathology and aetiology of disease, this book provides a reference for health care professionals interested in how to use metabolomics for medical research.
Foire aux questions
Comment puis-je résilier mon abonnement ?
Il vous suffit de vous rendre dans la section compte dans paramètres et de cliquer sur « Résilier l’abonnement ». C’est aussi simple que cela ! Une fois que vous aurez résilié votre abonnement, il restera actif pour le reste de la période pour laquelle vous avez payé. Découvrez-en plus ici.
Puis-je / comment puis-je télécharger des livres ?
Pour le moment, tous nos livres en format ePub adaptés aux mobiles peuvent être téléchargés via l’application. La plupart de nos PDF sont également disponibles en téléchargement et les autres seront téléchargeables très prochainement. Découvrez-en plus ici.
Quelle est la différence entre les formules tarifaires ?
Les deux abonnements vous donnent un accès complet à la bibliothèque et à toutes les fonctionnalités de Perlego. Les seules différences sont les tarifs ainsi que la période d’abonnement : avec l’abonnement annuel, vous économiserez environ 30 % par rapport à 12 mois d’abonnement mensuel.
Qu’est-ce que Perlego ?
Nous sommes un service d’abonnement à des ouvrages universitaires en ligne, où vous pouvez accéder à toute une bibliothèque pour un prix inférieur à celui d’un seul livre par mois. Avec plus d’un million de livres sur plus de 1 000 sujets, nous avons ce qu’il vous faut ! Découvrez-en plus ici.
Prenez-vous en charge la synthèse vocale ?
Recherchez le symbole Écouter sur votre prochain livre pour voir si vous pouvez l’écouter. L’outil Écouter lit le texte à haute voix pour vous, en surlignant le passage qui est en cours de lecture. Vous pouvez le mettre sur pause, l’accélérer ou le ralentir. Découvrez-en plus ici.
Est-ce que Metabolomics and Systems Biology in Human Health and Medicine est un PDF/ePUB en ligne ?
Oui, vous pouvez accéder à Metabolomics and Systems Biology in Human Health and Medicine par Oliver Jones, Oliver Jones en format PDF et/ou ePUB ainsi qu’à d’autres livres populaires dans Biological Sciences et Microbiology. Nous disposons de plus d’un million d’ouvrages à découvrir dans notre catalogue.
Informations
Sujet
Biological SciencesSous-sujet
Microbiology1 An Introduction to Metabolomics and Systems Biology
1.1 Introduction
Personalized medicine is anticipated to become a crucial paradigm in the future of healthcare. Key to the ability to tailor medicine to the individual patient is an understanding of the intricacies of an individual’s metabolism and its potential interaction(s) with potential treatments. The rise of functional genomics and systems biology has opened the door to understanding the interactions between genome, transcriptome, proteome and metabolome not only on a cellular level but also on a holistic level (i.e. the study of the individual as a complete system) and, despite being relatively new fields of research, both metabolomics and systems biology have a lot to offer to medical science. This chapter will outline the background of the fields of metabolomics and systems biology and explore their potential to generate new insights into human health and medicine.
Metabolomics attempts to quantify all of the small-molecule metabolites in a tissue, cell, biofluid or indeed whole organism. The term metabolome was first suggested by both Oliver et al. and Tweeddale et al. in the late 1990s (Oliver et al., 1998; Tweeddale et al., 1998); Oliver defined metabolomics as ‘measuring the concentrations of as many metabolites as possible to produce a metabolic snapshot’ and Tweeddale as measuring ‘the total complement of metabolites in a cell’. Nicholson et al. (at Imperial College London) defined the related concept of metabonomics at around the same time (Nicholson et al., 1999). While metabolomics and metabonomics have very similar definitions – being generally used to describe the use of analytical chemistry techniques, coupled with statistical analysis, to study the changes in a metabolome caused by a disease, perturbation or time course – the term metabolomics is more commonly employed in the literature and will be used here. More recently, the related concept of lipidomics has also arisen (Han and Gross, 2003), which specifically attempts to identify and quantify all of the lipids present in a biological sample. In 2007, Professor David Wishart’s team at the University of Alberta in Canada finished its first draft of the human metabolome database (http://www.hmdb.ca/). The latest draft (version 3.0, released in 2013) of this chemical counterpart of the human genome contains details of more than 40,000 metabolites, with 3100 compounds in urine alone (http://www.urinemetabolome.ca/). A diagram showing the ‘typical’ workflow of a metabolomics experiment is shown in Fig. 1.1.
The cellular metabolite pool serves as the ultimate expression of biological phenotype as it is influenced by the genome and proteome as well as external environmental, nutritional and xenobiotic factors (Nicholson et al., 2005; Dumas, 2012; Jones et al., 2012). Metabolomics can thus give a snapshot of the underlying biochemistry of a sample and, with repeated measurements taken over time, of cellular metabolism. Changes in metabolite levels can be observed as the result of a disease before clinical signs present (Chen and Snyder, 2012). Similarly, early changes in metabolism can be seen as a result of drug toxicity, presenting the opportunity to withdraw or change medication before the onset of pathological symptoms (Kaddurah-Daouk et al., 2007; Nicholson et al., 2012). Xenobiotic drug metabolism is also measurable (Clayton et al., 2009) and as metabolites are generally conserved across species, methods developed in academic or preclinical contexts can be readily translated to a human context.
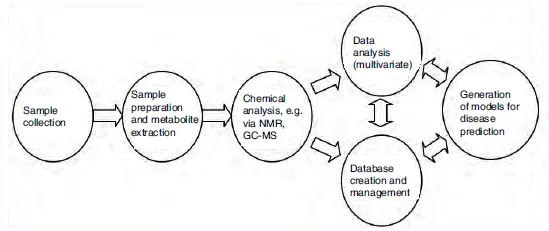
Fig. 1.1. An outline of a ‘typical metabolomics study’. (NMR, nuclear magnetic resonance spectroscopy; GC-MS, gas chromatography–mass spectrometry.)
1.2 Sample Preparation for Metabolomic Analysis
Once a tissue sample has been taken, metabolic processes must be stopped. If metabolism is permitted to continue after sampling, the metabolite concentrations in the sample will alter and may no longer reflect the processes in vivo. Typically, samples are flash frozen in liquid nitrogen and then stored below –20°C, or ideally below –70°C. This prevents enzymatic activity and slows metabolite breakdown.
If a tissue sample is then to be subjected to metabolite extraction, the sample is required to be homogenized. A pestle and mortar cooled by liquid nitrogen can be used, or for larger samples, an electric tissue homogenizer can provide a convenient alternative as it homogenizes tissue directly into the extraction solvent. The sample must not be allowed to thaw during the homogenization process, so addition of liquid nitrogen or dry ice to the pestle and mortar may help. Proteins/enzymes in the sample are then precipitated and metabolites extracted using either acid or cold organic solvents. Due to the wide variety of metabolites, each treatment has its merits and limitations. Perchloric acid, methanol–water, acetonitrile–water and methanol–chloroform–water are all in common use (Pears et al., 2005; Stentiford et al., 2005). Perchloric acid extraction has proven popular in the past and has been shown to achieve reasonable hydrophilic metabolite extraction, although it has been observed to give poor reproducibility between replicates (Lin et al., 2007). Organic solvent extractions are relatively straightforward and produce reasonable results. Acetonitrile extractions have good reproducibility but poor metabolite fractionation. Extractions based on methanol–chloroform–water demonstrate good reproducibility and yield for both hydrophilic and hydrophobic metabolites (Lin et al., 2007; Beltran et al., 2012); the organic fraction will contain lipids and lipid-soluble metabolites, while the aqueous fraction will contain some lipids and aromatic compounds, amino acids, choline metabolites, sugars, nucleic acids and creatine. The same solvent-based metabolite extraction methods used for homogenized tissue samples are also applicable to biofluids such as urine, plasma and cerebrospinal fluid. Solvent-based metabolite extraction can be used to produce samples that are suited to analysis by both nuclear magnetic resonance spectroscopy (NMR) and mass spectrometry (MS) (Beltran et al., 2012).
1.3 Analytical Methodologies
Due to the diversity of metabolites present in most biological samples and their wide range of physical properties (e.g. lipids, nucleic acids, amino acids, sugars), it is difficult to envisage a single analytical technique capable of quantifying the entire metabolome. As a result a number of different technologies have been employed with the most common being NMR and MS. Although these techniques are the most commonly used, in practice any method capable of quantifying a large number of metabolites can be employed, including Fourier transform ion cyclotron resonance spectroscopy (FT-ICR), high-pressure liquid chromatography (HPLC), thin layer chromatography (TLC) and capillary electrophoresis (CE). An overview of the more common techniques is given in Table 1.1 and below.
Table 1.1. A summary of common analytical techniques used in metabolomics.
Analytical technique | Advantages | Disadvantages |
Nuclear magnetic resonance spectroscopy (NMR) | • Robust and reproducible • Minimal sample preparation required • Sample analysis is fast (~7 min) and robust • Non-destructive • All kinds of small-molecule metabolites can be measured simultaneously | • Low analytical sensitivity • More than one peak per compound in most cases, meaning spectra are often complex • Does not analyse fats and lipids well • NMR spectrometers can take up a lot of space |
Gas chromatography–mass spectrometry (GC-MS) | • High analytical sensitivity • Robust and reproducible technique • Large dynamic range • Compound identification is facilitated by large, well-established mass spectral libraries | • Sample analysis can be slow (20-30 min per sample) • The similarity of isomers can make it difficult to identify compounds • Many metabolites are non-volatile and must be derivatized prior to analysis • Many large molecules (e.g. proteins) cannot be measured |
Liquid chromatography–mass spectrometry (LC-MS) | • High analytical sensitivity • Robust technique • Large dynamic range • No derivatization required (usually) | • Analysis can be slow • Reproducibility issues and matrix effects can hinder compound identification • There are very few commercial libraries |
Capillary electrophoresis-mass spectrometry (CE-MS) | • High separation power • No chemical derivatization needed (usually) • Can analyse neutrals, anions and cations in a single run | • There are almost no commercial libraries available • Poor retention time reproducibility • Technique is currently not as well developed as the others |
1.3.1 Nuclear magnetic resonance spectroscopy (NMR)
Solution-state NMR
NMR has long been a mainstay of metabolomic analysis and can detect metabolites down to a concentration of 5–10 μmol/l (Salek et al., 2007; Lindon and Nicholson, 2008; Heather et al., 2013). It provides a relatively simple method for measuring the ensemble of metabolites present in a solution with minimal sample preparation. Every nucleus has a quantum mechanical property called spin, which can take a value in increments of ½. NMR makes use of those nuclei with a noninteger spin, such as 1H, 13C and 31P. It is helpful to imagine the nuclear spin as a vector that aligns with the direction of the applied magnetic field. This vector precesses about the applied magnetic field vector with a characteristic frequency (Larmor frequency). If a nucleus is excited with a radio-frequency oscillating magnetic field, we can then record its exponential decay back to equilibrium – the free induction decay (FID). A Fourier transform of the FID converts the time-domain FID into a frequency-domain spectrum with a peak corresponding to the precessional frequency of the nucleus; this frequency, or chemical shift, is commonly reported in magnetic field-independent units of parts per million (ppm). The amplitude of the peak is directly proportional to the number of nuclei of that type present in the solution and can therefore be used to quantify the concentration of a compound in solution.
The above description is a gross simplification of NMR but serves as a useful model for understanding the method; a more complete description of NMR including the quantum mechanics involved can be found elsewhere (Keeler, 2005). NMR is relatively insensitive, especially when compared with MS; however, it is typically reliable and, because the sample is introduced into the spectrometer in a tube, the spectrometer does not need cleaning, performance is maintained and the sample is not destroyed. Samples with a high salt content, such as urine, are also readily analysed except in very extreme cases.
The chemical shift of a nucleus is dependent on the exact magnetic field experienced, which is governed by the applied magnetic field and by the effects of the electrons surrounding the nucleus. As the electronic environment of the nucleus is determined by the chemical structure of the molecule, each molecule gives rise to a characteristic pattern of chemical shifts in its NMR spectrum. This pattern of chemical shifts can therefore be used to identify the compound in the spectrum. As a metabolomic sample typically contains a complex mixture of compounds, the resulting NMR spectrum will contain a complex pattern of peaks. The chemical shift range for 1H spectra is small; these peaks may overlap, complicating the identification of the compounds. The solvent used to dissolve the sample may also have a peak in the spectrum. As the solvent, typically water, has a very high concentration compared with that of the metabolites in solution (110 mol/l versus 1 mmol/l), the solvent peak can dominate the spectrum. This distorts the shape of the metabolite peaks and compresses them into the noise baseline of the spectrometer’s analogue-to-digital converter (ADC). Solvent suppression methods exist to mitigate the solvent peak allowing the amplification of the metabolite signal without overflowing the ADC. Commonly, a nuclear Overhauser effect spectroscopy (NOESY) pre-saturation solvent suppression module is employed (Lindon et al., 2011).
1H-NMR is commonly used as it provides the greatest NMR signal of the commonly available nuclei. 13C is present in natural abundance at ~1 % (~99 % of carbon is present as NMR-inactive 12C) and also provides a considerably smaller NMR signal than 1H. It is possible to acquire a spectrum of 13C although its signal-to-noise ratio (SNR) will be considerably lower than that of 1H. Where signal-to-noise is low, multiple FIDs are acquired and averaged with the result that the SNR improves with the square root of the number of averages.
Advanced NMR
Overlapping peaks can be resolved by the use of multidimensional spectroscopy. Two-dimensional (2D) or even three-dimensional (3D) spectroscopy typically makes use of through-bond coupling (the interaction of bonded nuclei in a molecule) to correlate the frequency of a nucleus with that of a nucleus to which it is bonded. 2D correlation spectroscopy (COSY) allows the correlation of hydrogen nuclei bonded to neighbouring carbon nuclei (e.g. R–CH–CH–R’). This results in a 2D spectrum with the x-axis of the spectrum corresponding to the chemical shift of the first component of the coupled system and the y-axis corresponding to the second component of the coupled system (Lindon et al., 2011). Other 2D spectra include total correlation spectroscopy (TOCSY, or occasionally TCOSY), which correlates multiple hydrogen nuclei bonded on the same carbon skeleton (e.g. R–HC–HC–HC–R′). J-resolved (JRES) spectroscopy correlates j-coupling (splitting of a single NMR peak into peak multiplets as a result of coupling to other nuclei) on to one axis of the spectrum and chemical shift of the nucleus on to the other, reducing spectral overlap of neighbouring multiplets (Lindon et al., 2011). Heteronuclear experiments can correlate the chemical shift of a hydrogen nucleus with that of a hetero-nucleus (e.g. 13C or 15N) to which it is connected through bonding. Heteronuclear single quantum coupling (HSQC) spectra correlate 1H with a heteronucleus connected through one bond. Heteronuclear multiple bond coupling (HMBC) experiments can correlate 1H with a heteronucleus connected by two, three or four bonds. Such multidimensional experiments can not only aid in identification of the metabolite but also provide structural information about the compound, allowing the identification of unknown metabolites (Lindon and Nicholson, 2008).
Modern NMR spectrometers can be fitted with a sample-loading robot which allows multiple samples to be loaded into the spectrometer automatically and a series of spectra acquired for each sample. Similarly, flow probes exist that allow the samples to be loaded using a liquid-handling robot and can require a greatly reduced sample volume. The advent of cryo-probes, which cool the electronics of the NMR probe to cryogeneic temperatures, has greatly improved the sensitivity of NMR. The cooling reduces the thermal noise introduced by the probe itself, resulting in considerable improvement in the SNR of the spectrum by a factor of up to five – a 25-fold reduction in the acquisition time of the spectrum (Lindon and Nicholson, 2008).
Solid-state NMR
High-resolution magic-angle-spinning (HRMAS) NMR allows the recording of an NMR spectrum from a solid sample. By placing a tissue sample in...