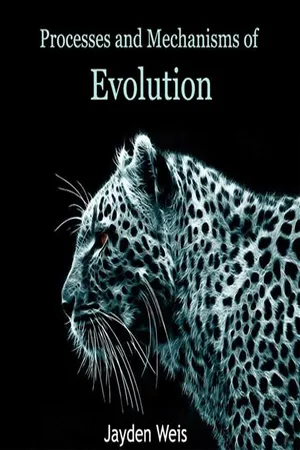
Biological Sciences
Genetic Drift
Genetic drift refers to the random fluctuation of allele frequencies in a population due to chance events. It is a mechanism of evolution that can lead to the loss of genetic variation over time. Genetic drift is more pronounced in small populations and can result in the fixation of certain alleles, leading to reduced genetic diversity.
Written by Perlego with AI-assistance
Related key terms
1 of 5
11 Key excerpts on "Genetic Drift"
 No longer available |Learn more
- (Author)
- 2014(Publication Date)
- The English Press(Publisher)
________________________ WORLD TECHNOLOGIES ________________________ Chapter- 2 Genetic Drift Genetic Drift or allelic drift is the change in the frequency of a gene variant (allele) in a population due to random sampling. The alleles in the offspring are a sample of those in the parents and chance has a role in determining whether a given individual survives and reproduces. A population's allele frequency is the fraction of the copies of one gene that share a particular form. Genetic Drift is an important evolutionary process, which leads to changes in allele frequencies over time. It may cause gene variants to disappear completely and thereby reduce genetic variation. In contrast to natural selection, which makes gene variants more common or less common depending on their reproductive success, the changes due to Genetic Drift are not driven by environmental or adaptive pressures and may be beneficial, neutral, or detrimental to reproductive success. The effect of Genetic Drift is larger in small populations and smaller in large populations. Vigorous debates wage among scientists over the relative importance of Genetic Drift compared with natural selection. Ronald Fisher held the view that Genetic Drift plays at the most a minor role in evolution and this remained the dominant view for several decades. In 1968 Motoo Kimura rekindled the debate with his neutral theory of molecular evolution, which claims that most changes in genetic material (although not necessarily changes in phenotypes) are caused by Genetic Drift. Analogy with cans of paint A painter P 1 has 20 cans of paint, 10 red and 10 blue, in the back of his truck. Another painter ( P 2 , representing the following generation) comes up with 20 empty cans that he wants filled. The first painter, obliging, fills an empty can from one of his own randomly selected cans and returns his can to the back of his truck. eBook - ePub
- John H. Relethford(Author)
- 2012(Publication Date)
- Wiley-Blackwell(Publisher)
. We can also use probability theory to make some general statements about the likelihood of a set of events occurring. For example, if we flip 10 coins, how many will come up heads? We might be very lucky and get 10 heads. We could also get 9 heads and 1 tail. The other possibilities are 8, 7, 6, 5, 4, 3, 2, 1, or 0 heads. Although we cannot tell beforehand what the specific outcome of any given toss of 10 coins will be, we can derive the probability of the occurrence of any of those outcomes. For example, the probability of getting all heads from 10 coin flips is roughly one in 1000 (0.000977), and the probability of getting 5 heads out of 10 coin flips is 0.246 (see any introductory statistics book for an explanation of how to do this).Genetic Drift is also a random process. Here, allele frequencies can fluctuate from generation to generation because of chance. Under Hardy–Weinberg equilibrium, we expect allele frequencies to remain constant from one generation to the next in the absence of mutation, selection, or gene flow. As noted in Chapter 2, an assumption of Hardy–Weinberg equilibrium is an infinite population size so there is no sampling deviation. In the real world, there are sampling deviations, and allele frequencies can increase or decrease by chance. As with coin flips, we cannot predict beforehand exactly what will happen as a result of Genetic Drift, but the principles of probability allow us to figure out the likelihood of different events occurring.5.1 What is Genetic Drift?Although it is easy to give the definition of Genetic Drift as a random fluctuation in allele frequencies over time, it is more difficult to get a feel for what this actually means in an evolutionary context. We will start by considering the effect of sampling in a genetic context and then build to an example of Genetic Drift.5.1.1 Genetic SamplingLet us start with a simple example. Assume that there is a locus with two alleles, A and a , and that you have the heterozygous genotype Aa . When you have a child, you will pass along either the A allele or the a allele. Each event has a 50% chance of happening. Therefore, you might expect to pass on the A allele half of the time and the a allele half of the time. Now, suppose that you have four children. How many children do you expect to receive the A allele? Although your expectation would be to have two children with the A allele and two children with the a eBook - PDF
Not by Design
Retiring Darwin’s Watchmaker
- John Reiss(Author)
- 2009(Publication Date)
- University of California Press(Publisher)
NATURAL SELECTION AND Genetic Drift 233 At the same time, to understand what is happening in populations at a descrip-tive level—namely, at the level of actual (not expected) rates of increase—seems by no means impossible. Nor does it seem impossible to isolate particular causal influences on these rates of increase. It is this more limited goal, rather than the complete determination of the expected evolution of a population, that one might realistically hope to achieve. Nevertheless, it also seems reasonable to believe that in general what one does observe will be fairly close to what one might expect to observe under some expected distribution of genotypes and environments, and the more so the larger the population observed. With this general introduction to the physical meaning of Genetic Drift, I would like to turn to a brief historical overview of the origin of the concept. We will see that although the mathematical development indeed justifies calling this the Wright-Fisher or Fisher-Wright model, the theory of drift played a very different role for Fisher than it did for Wright. This point again is connected to the question of how we want to regard our models of populations: are they merely heuristic aids to understanding what is happening in the real world, or are they explicit representa-tions of real relations, of which the appropriate parameter values can be determined for real populations? THE HAGEDOORNS, FISHER, AND THE ORIGINS OF Genetic Drift Because both Darwin and Wallace had made natural selection a mechanism that acts in accordance with the laws of probability, rather than completely determin-istically, a role for chance in evolution was implicit from the beginning. However, with the rise of Mendelism, the statistical nature of the Mendelian ratios made it inevitable that chance should now prominently enter evolutionary theory, where it had previously been a minor factor (except in its role in the “chance” origin of variants). eBook - PDF
- Anatoly Ruvinsky(Author)
- 2009(Publication Date)
- CRC Press(Publisher)
Accordingly the frequency of an allele or a genotype in a small population can rise or fall considerably and rapidly (Figure 6.2 a-d). This purely random process is dependent on a number of reproducing individuals in a population and time, which is usually measured in generations. In small populations the intensity of the drift is high. An allele can be fixed in a population, when its frequency reaches a value of 1; it also means that an alternative allele is lost. These two points are critical because further Genetic Drift of allelic frequencies in the popu-lation becomes impossible until a new allele appears in the population due to a mutation or migration. Wright’s conclusion was deemed to be very important as it discovered a previously unappreciated factor of evo-lution and this was a fundamental contribution to population genetics. At the same time and independently, similar views were developed by Russian geneticists D.D. Romashov and N.P. Dubinin in 1931 to 1932 (Dubinin 1931; Dubinin and Romashov 1932), which were inspired by population genet-ics studies initiated by Tchetverikov (Adams 1970). Andrei N. Kolmogorov, one of the leading mathematicians of the twentieth century, who among other achievements made a solid contribution to the probability theory, was well aware of their research as he was Romashov’s classmate and knew Dubinin from his college years (Tihomirov 2003; Adams 1970). At about the same time Kolmogorov developed a mathematical theory of stochastic changes, which is relevant to population genetic processes. The time-dependent solution of the forward Kolmogorov (Fokker–Planck) equation describing the stochastic changes in allelic frequencies in a finite population, developed by Kimura (1955) a quarter of century later, became an important advancement of the Genetic Drift theory (Ewens and Heyde 1995). eBook - ePub
- Matthew Hamilton, Matthew B. Hamilton(Authors)
- 2011(Publication Date)
- Wiley-Blackwell(Publisher)
The random nature of Genetic Drift can be seen by the zig-zag changes in allele frequency that have no apparent direction. Allele frequencies that reach the upper or lower axes represent cases of fixation or loss. In the bottom panels, the genotype frequencies are shown for the allele frequencies represented by the black and blue lines under the assumption of random mating within each generation. The changes in genotype frequencies are a consequence of changes in allele frequencies due to Genetic Drift. The bottom panels of Fig. 3.3 show genotype frequencies based on random mating for one of the populations represented in the top panels. Genetic Drift clearly causes genotype frequencies to change over time along with the changes in allele frequency. This is in contrast to the processes considered in Chapter 2, such as consanguineous mating, that result in changes in genotype frequency only but do not alter allele frequency. Genetic Drift is most commonly modeled and demonstrated from the perspective of allele frequencies since it is easier to summarize a diallelic locus in a population as two allele frequencies rather than three genotype frequencies. But remember that genotype frequencies are affected by Genetic Drift too, and genotype frequencies can always be obtained by multiplication given allele frequencies under the assumption of random mating. Figure 3.4 The results of Genetic Drift with different initial allele frequencies. The two panels have identical population sizes (N = 25) but initial allele frequency is p = 0.2 on the right and p = 0.8 on the left. The chances of fixation are equal to the initial allele frequency, a generalization that can be seen by examining a large number of replicates of Genetic Drift. Consistent with this expectation, more replicates go to loss on the left and more reach fixation on the right No longer available |Learn more
- (Author)
- 2014(Publication Date)
- Learning Press(Publisher)
As a result, when selective forces are absent or relatively weak, allele frequencies tend to drift upward or downward randomly (in a random walk). This drift halts when an allele eventually becomes fixed, either by disappearing from the population, or replacing the other alleles entirely. Genetic Drift may therefore eliminate some alleles from a popula-tion due to chance alone. Even in the absence of selective forces, Genetic Drift can cause two separate populations that began with the same genetic structure to drift apart into two divergent populations with different sets of alleles. The time for an allele to become fixed by Genetic Drift depends on population size, with fixation occurring more rapidly in smaller populations. The number of individuals in a population is not critical, but instead a measure known as the effective population size. ________________________ WORLD TECHNOLOGIES ________________________ The effective population is always smaller than the total population since it takes into account factors such as the level of inbreeding, the stage of the lifecycle in which the population is the smallest, and the fact that some neutral genes are genetically linked to others that are under selection. The effective population size may not be the same for every gene in the same population. It is usually difficult to measure the relative importance of selection and drift, so the comparative importance of these two forces in driving evolutionary change is an area of current research. These investigations were prompted by the neutral theory of molecular evolution, which proposed that most evolutionary changes are the result of the fixation of neutral mutations that do not have any immediate effects on the fitness of an organism. Hence, in this model, most genetic changes in a population are the result of constant mutation pressure and Genetic Drift. eBook - ePub
- Alan R. Templeton(Author)
- 2018(Publication Date)
- Academic Press(Publisher)
Eq. (4.26) tells us thatGenetic Drift causes the average probability of identity by descent with respect to some reference generation to increase with time and to be an inverse function of the number of gametes sampled such that the smaller the population, the more rapid the accumulation of identity by descent.Note that as t gets larger, the probability of identity by descent goes to 1. This means that all genetic variation at this locus is eventually lost due to Genetic Drift, at a per generation rate of 1/(2N ). Note also the similarity of Eqs. (4.26 ) and (4.19 ). Eq. (4.19) is measuring the variance of allele frequencies across identical isolates or alternatively the increase in variance of allele frequency within a population as a function of time from a reference population. Hence, in our ideal population, the impact of Genetic Drift on a wide variety of evolutionary parameters follows exactly the same dynamics and in all cases is inversely proportional to 1/(2N ) per generation.An example of how Genetic Drift increases the average amount of pedigree inbreeding is shown by another human isolate, the population on the remote Atlantic island of Tristan da Cunha (Roberts, 1968 ). This island was colonized by 20 British citizens between 1816 and 1820 and had grown to 270 individuals by 1960, but with some dramatic dips in population size (Fig. 4.5 ). Hence, Genetic Drift was a powerful evolutionary force in this isolate. This isolate was a religious colony with a strong incest taboo, so the system of mating was one of avoidance of inbreeding. As shown in Chapter 3 (see Eq. 3.17 ), a system of mating of avoidance of inbreeding has its strongest genetic impact in small populations. Nevertheless, Fig. 4.5 shows that pedigree inbreeding (as calculated from the actual pedigrees, using the original 20 founders as the reference generation) started occurring in the 1850s and rose to about 0.05 by the 1930s, one of the highest average pedigree inbreeding coefficients in any human population. The reason for this increase in pedigree inbreeding in a colony actively avoiding system of mating inbreeding is simple: by the 1850s, virtually every individual of marriageable age of one sex was a known relative to every individual of marriageable age of the opposite sex. In a small population, Genetic Drift insures that all individuals become related in just a few generations, so complete avoidance of pedigree inbreeding (measured by F ) is impossible even if the system of mating is one of maximal avoidance of inbreeding (measured by f ). This illustrates why it is so important to keep f and F distinct even though they are both commonly called “inbreeding coefficients.” As Fig. 4.5 shows, F is more a measure of Genetic Drift, whereas f eBook - PDF
- Matthew B. Hamilton(Author)
- 2021(Publication Date)
- Wiley-Blackwell(Publisher)
CHAPTER 3 Genetic Drift and effective population size 3.1 The effects of sampling lead to Genetic Drift • Biological populations are finite. • A simple sampling experiment with micro- centrifuge tube populations. • The Wright–Fisher model of sampling. • Sampling error and Genetic Drift in biological populations. In Chapter 2, that population size is very large, effec- tively infinite, was among the assumptions listed for Hardy–Weinberg expected genotype frequencies to be realized. This entire chapter will be devoted to the changes in allele and genotype frequency that occur when this assumption is not met and popula- tions are small or at least finite. Population size has profound effects on allele frequencies in biological populations and has a specific definition in the con- text of population genetics. A variable for population size in one form or another appears in many of the fundamental equations used to predict genotype or allele frequencies in populations. In those expecta- tions where no explicit variable for population size appears, there is an assumption instead, just as in the Hardy–Weinberg expectation for genotype fre- quencies. There is a strong biological motivation behind this attention to population size. All biological populations, without exception, are finite. Therefore, no actual population ever exactly meets the popula- tion size assumption of Hardy–Weinberg, although some may be large enough to show few genetic effects of finite size over relatively short periods of time. There is also a tremendous range of population sizes in the biological world. An understanding of the population genetic effects of population size will help to explain why some populations and species violate the assumptions to a greater degree than others, making sense of both the factors that cause differ- ences in population size and the consequences of such differences. eBook - PDF
- Torbjörn Säll, Bengt O. Bengtsson(Authors)
- 2017(Publication Date)
- Wiley-Blackwell(Publisher)
Derivation 5 The evolution of genetic diversity The derivations in this chapter continue to describe the effect of biolog-ical populations being finite in size, even if potentially large in number. We start by finding the formula for how much genetic variation is expected in a diploid population where both mutation and Genetic Drift operate. The same population model is assumed as in the last chapter – the simple and well-defined Wright–Fisher model – though it is here used for going forward rather than backward in generations. We then extend our results by investigating how long it takes for a population to build up its standing genetic variation, and for how long the variation in a population will ‘remember’ a prior demographic disturbance to its current size. In our derivations, we assume that every new mutation leads to a new allelic type. The biological background to this assumption is discussed at the end of the chapter, where we introduce the infinite sites model of genes and DNA stretches. Within the framework of this model, it is possible to analyse gene copies, not only with respect to them being dif-ferent or not, but from the point of view of how different they are. When such information is available, powerful phylogenetic reconstructions can be made, and we sketch the basis for such work. We also discuss how sequence information can be used to test the processes that have led to the currently existing genetic variation in a population: Is the variation affected solely by random processes, or is there an indication that, for example, selection has also been involved? The chapter finishes with a brief comment on the versatility of methods with which population genetic equations can be analysed. Understanding Population Genetics , First Edition. Torbjörn Säll and Bengt O. Bengtsson. © 2017 John Wiley & Sons Ltd. Published 2017 by John Wiley & Sons Ltd. [ 85 ] eBook - PDF
Rates of Evolution
A Quantitative Synthesis
- Philip D. Gingerich(Author)
- 2019(Publication Date)
- Cambridge University Press(Publisher)
12 Genetic Models The widest disparity which has so far developed in the field of population genetics is that which separates those who accept from those who reject the theory of “drift” or “non-adaptive radiation,” as it has been called by its author, Professor Sewall Wright of Chicago. R. A. Fisher and E. B. Ford, Heredity, 1950, p. 117 There are many good biologists who think that natural selection is almost, or in fact is, irrelevant to evolution. Because many are molecular biologists, their view might be called the “molecular” view, but there is broad overlap with both the “random” and “constraint” views. John Endler, Natural Selection in the Wild, 1986, p. 240 Sewall Wright (1931) is famous for developing the theory that subdivision of a population into small isolated or semi-isolated groups is important for evolution because it promotes random changes in gene frequencies. Later Ronald A. Fisher and E. B. “Henry” Ford, responding to Wright, made the observation highlighted in the epigraph. Fisher and Ford (1950) reported that large as well as small populations experience changes in gene frequencies beyond any effect attributable to population size, and considered the observation fatal for the “Sewall Wright effect.” The Sewall Wright effect has survived, and Genetic Drift remains a central idea in modern evolutionary theory. Here we consider genetic models that have been used to study both drift and selection in long-term evolution documented in the fossil record. 12.1 Natural Selection and Random Drift in Phenotypic Evolution Russell Lande (1976) used population-genetic methods to develop models for the evolution of an average phenotype in a population, first by natural selection, and then by random Genetic Drift. 298 12.1.1 Minimum Selection in Observed Evolutionary Events Lande first calculated the natural selection required to produce rates of evolution observed in quantitative (polygenic) characters changing through geological time. eBook - ePub
- Mark Jobling, Edward Hollox, Toomas Kivisild, Chris Tyler-Smith(Authors)
- 2013(Publication Date)
- Garland Science(Publisher)
As Genetic Drift is a random process, it is impossible to predict which allele survives. A model that describes Genetic Drift in a finite population in combination with the other assumptions of the HWE (Section 5.1) is known as the Wright–Fisher model. This model is funda-mental to many aspects of population genetics. Figure 5.5: Genetic Drift in populations of different sizes. The results of simulations (over 100 generations) of allele frequencies of a binary polymorphism in diploid organism populations of size 20 or 1000 (each starting from a frequency of 0.5) are shown. The populations are of constant size and have non-overlapping generations; each generation is sampled randomly from the previous one (so individuals have an equal probability of contributing to the next generation). The allele rapidly becomes either fixed or lost from the populations of constant size 20, whereas more subtle variations are seen in the populations of constant size 1000. The effective population size is a key concept in population genetics The Wright–Fisher model, like the HWE model, contains many unrealistic assumptions when compared with real populations. First, generations overlap in real human populations; second, populations are rarely constant in size; and third, large populations do not exhibit random mating. These three factors differ in importance for any given population. Wright’s concept of effective population size (N e) allows us to compare the amount of Genetic Drift experienced by different populations. 7 N e for any population represents the size of an idealized Wright–Fisher population that experiences the same amount of Genetic Drift as the one under study. It measures the magnitude of Genetic Drift: the smaller N e, the greater the drift
Index pages curate the most relevant extracts from our library of academic textbooks. They’ve been created using an in-house natural language model (NLM), each adding context and meaning to key research topics.