Mathematics
Instantaneous Rate of Change
The instantaneous rate of change is the rate at which a quantity is changing at a specific point in time. In calculus, it is represented by the derivative of a function and gives the slope of the tangent line to the graph of the function at a particular point. It provides a precise measure of how a function is changing at a single moment.
Written by Perlego with AI-assistance
Related key terms
1 of 5
11 Key excerpts on "Instantaneous Rate of Change"
 eBook - PDF
Mathematics NQF4 SB
TVET FIRST
- M Van Rensburg, I Mapaling M Trollope(Authors)
- 2017(Publication Date)
- Macmillan(Publisher)
Calculus is divided in two main fields: differentiation and integration . Differentiation allows us to find the rate of change of a function at one particular moment ( Instantaneous Rate of Change ). We’ll discuss this in Unit 6.1. When you simplify a situation or problem in real life in such a way that you express it and solve it mathematically, you use ‘mathematical modelling ’. calculus: a powerful mathematical tool with applications in science, technology and economics differentiation: to use limits and find the derivatives of functions in order to tell the rate of change of such functions at one particular moment New words 121 Module 6 In this module we investigate and use Instantaneous Rate of Change of a variable when interpreting models both in mathematical and real-life situations. Unit 6.1: Derivatives of functions from first principles Rate of change is about one thing changing in relation to another thing. It is often calculated as an average. For example, to calculate speed, you will divide the distance travelled by a certain time interval. Therefore, a straight-line graph showing the relation between speed, time and distance will have a constant gradient , because there is a constant rate of change. This gradient is the average speed in the given time interval. However, scientists and mathematicians may need to find the speed at one specific moment in time, rather than an average over a certain time period. This is known as the Instantaneous Rate of Change. 6.1.1 Instantaneous Rate of Change Think about the reading on the speedometer of a car. This reading changes as soon as the car speeds up or slows down, so it keeps giving the car ′ s speed at a particular moment in time. How do we calculate rate of change at a particular instant if the formula for calculating rate of change is given as change per change in time? • To pinpoint the rate of change, we would need a very detailed table of values or a detailed graph. No longer available |Learn more
- Gary Bronson, Richard Bronson, Maureen Kieff(Authors)
- 2021(Publication Date)
- Mercury Learning and Information(Publisher)
x ), the limit defined in Equation 5.3 will exist at that point. Because this slope is the value of the Instantaneous Rate of Change at the given point, Equation 5.3 can be rewritten as:The Instantaneous Rate of Change in f (x ) at x 1(Eq. 5.4)In the next section, we show that the calculus term derivative is another name for the Instantaneous Rate of Change. That is, the derivative of a function at a point is the Instantaneous Rate of Change of the function at that point. We then show how to use Equation 5.4 to find the derivative (the Instantaneous Rate of Change) of a function f (x ) for any value of x , for which the limit in Equation 5.4 exists.UnitsInstantaneous rates of change, as their average rates of change counterparts, measure the change in a dependent variable versus a change in its corresponding independent variable. As such, the units associated with both of these rates of change are the same.For example, the average rate of change calculated in Example 1 of the previous section was the change in distance versus a change in time, more commonly known as speed. This measure is the same for both the average over a long trip or the instantaneous measure provided by a car’s speedometer.Example 1 A function that measures fuel efficiency for automobiles gives the distance traveled, m , for the amount of gasoline used, in gallons, g . That is, m = f (g ). Determine the units associated with the Instantaneous Rate of Change of f with respect to gasoline consumption.Solution m is measured in units of miles and g is measured in units of gallons. Thus, the Instantaneous Rate of Change of m with respect to g has units of mile per gallon, commonly known as mpg .Example 2 The graph in Figure 5.10 eBook - PDF
- James Stewart, Daniel K. Clegg, Saleem Watson, , James Stewart, James Stewart, Daniel K. Clegg, Saleem Watson(Authors)
- 2020(Publication Date)
- Cengage Learning EMEA(Publisher)
The instan- taneous rate of change is the limit of the average rates of change, so it is measured in the same units: billions of dollars per year. Copyright 2021 Cengage Learning. All Rights Reserved. May not be copied, scanned, or duplicated, in whole or in part. Due to electronic rights, some third party content may be suppressed from the eBook and/or eChapter(s). Editorial review has deemed that any suppressed content does not materially affect the overall learning experience. Cengage Learning reserves the right to remove additional content at any time if subsequent rights restrictions require it. 116 CHAPTER 2 Derivatives rate of change of production cost with respect to the number of items produced; the rate of change of the debt with respect to time is of interest in economics. Here is a small sample of other rates of change: In physics, the rate of change of work with respect to time is called power. Chemists who study a chemical reaction are interested in the rate of change in the concentration of a reactant with respect to time (called the rate of reaction). A biologist is interested in the rate of change of the population of a colony of bacteria with respect to time. In fact, the computation of rates of change is important in all of the natural sciences, in engineering, and even in the social sciences. Further examples will be given in Section 2.7. All these rates of change are derivatives and can therefore be interpreted as slopes of tangents. This gives added significance to the solution of the tangent problem. Whenever we solve a problem involving tangent lines, we are not just solving a problem in geom- etry. We are also implicitly solving a great variety of problems involving rates of change in science and engineering. 2.1 Exercises 1. A curve has equation y - f s xd. (a) Write an expression for the slope of the secant line through the points Ps3, f s3dd and Qs x, f s xdd. (b) Write an expression for the slope of the tangent line at P . eBook - PDF
- Deborah Hughes-Hallett, Patti Frazer Lock, Andrew M. Gleason, Daniel E. Flath, Sheldon P. Gordon, David O. Lomen, David Lovelock, William G. McCallum, Brad G. Osgood, Andrew Pasquale, Jeff Tecosky-Feldman, Joseph Thrash, Karen R. Rhea, Thomas W. Tucker(Authors)
- 2018(Publication Date)
- Wiley(Publisher)
CONTENTS 2.1 Instantaneous Rate of Change . . . . . . . . . . . . . . . . . . . . . . . . . . . . . . . . . . . . . 2.2 The Derivative Function . . . . . . . . . . . . . . . . . . . . . . . . . . . . . . . . . . . . . . . . . . . 2.3 Interpretations of the Derivative . . . . . . . . . . . . . . . . . . . . . . . . . . . . . . . . . . 2.4 The Second Derivative . . . . . . . . . . . . . . . . . . . . . . . . . . . . . . . . . . . . . . . . . . . 2.5 Marginal Cost and Revenue . . . . . . . . . . . . . . . . . . . . . . . . . . . . . . . . . . . . . . Focus on Theory: Limits and the Definition of the Derivative . . . . . . . . . . . Chapter 2 RATE OF CHANGE: THE DERIVATIVE 88 Chapter 2 RATE OF CHANGE: THE DERIVATIVE 2.1 Instantaneous Rate of Change Chapter 1 introduced the average rate of change of a function over an interval. In this section, we consider the rate of change of a function at a point. We saw in Chapter 1 that when an object is moving along a straight line, the average rate of change of position with respect to time is the average velocity. If position is expressed as = (), where is time, then Average rate of change in position between = and = = Δ Δ = () − () − . If you drive 200 miles in 4 hours, your average velocity is 200∕4 = 50 miles per hour. Of course, this does not mean that you travel at exactly 50 mph the entire trip. Your velocity at a given instant during the trip is shown on your speedometer, and this is the quantity that we investigate now. Instantaneous Velocity We throw a grapefruit straight upward into the air. Table 2.1 gives its height, , at time . What is the velocity of the grapefruit at exactly = 1? We use average velocities to estimate this quantity. Table 2.1 Height of the grapefruit above the ground (sec) 0 1 2 3 4 5 6 = () (feet) 6 90 142 162 150 106 30 The average velocity on the interval 0 ≤ ≤ 1 is 84 ft/sec and the average velocity on the interval 1 ≤ ≤ 2 is 52 ft/sec.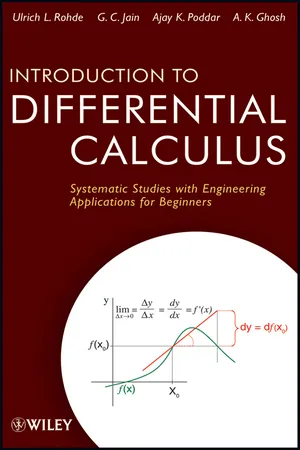 eBook - ePub
Introduction to Differential Calculus
Systematic Studies with Engineering Applications for Beginners
- Ulrich L. Rohde, G. C. Jain, Ajay K. Poddar, A. K. Ghosh(Authors)
- 2012(Publication Date)
- Wiley(Publisher)
acceleration .As another example, the pressure of the atmosphere varies with height above the surface of the Earth. Given the formula that relates pressure and height, we can calculate the rate of change of pressure compared to height at any given height and the rate of change of surface area of a cube, with respect to the length of its edge.26Remark: The original calculus problems of speed and acceleration did involve time and were concerned with rates at an instant of time. Our interest lies in computing the rate of change of the dependent variable y [= f (x )] with respect to the independent variable x at any value of x . All such rates are referred to as instantaneous rates , despite the fact that time may not be one of the variables involved.9.5.5 From the above discussion, we note the following:i. If y is a function of x denoted by y = h (x ), whose graph is a curve, then the slope of the curve at any point P (x , y ) on the curve, is given by the limit , provided this limit exists . We denote it by .ii. Consider a particle “P” moving in a straight line. Suppose the position of the particle at any instant “t ” is expressed by function y = g (t ), then the velocity of the particle at any instant t is given by the limit , provided this limit exists . We denote it by .iii. Let the velocity of a particle at any instant t be given by the function v = ϕ(t ), then the Instantaneous Rate of Change of velocity at any instant t , is given by the limit , provided this limit exists . We denote it by . It is called the instantaneous acceleration of the particle eBook - PDF
Calculus
Early Transcendentals
- Howard Anton, Irl C. Bivens, Stephen Davis(Authors)
- 2016(Publication Date)
- Wiley(Publisher)
79 2 One of the crowning achievements of calculus is its ability to capture continuous motion mathematically, allowing that motion to be analyzed instant by instant. THE DERIVATIVE Many real-world phenomena involve changing quantities—the speed of a rocket, the inflation of currency, the number of bacteria in a culture, the shock intensity of an earthquake, the voltage of an electrical signal, and so forth. In this chapter we will develop the concept of a “derivative,” which is the mathematical tool for studying the rate at which one quantity changes relative to another. The study of rates of change is closely related to the geometric concept of a tangent line to a curve, so we will also be discussing the general definition of a tangent line and methods for finding its slope and equation. 2.1 TANGENT LINES AND RATES OF CHANGE In this section we will discuss three ideas: tangent lines to curves, the velocity of an object moving along a line, and the rate at which one variable changes relative to another. Our goal is to show how these seemingly unrelated ideas are, in actuality, closely linked. TANGENT LINES In Example 1 of Section 1.1 we used an informal argument to find the equation of a tangent line to a curve. However, at that stage in the text we did not have a precise definition of a tangent line. Now that limits have been defined precisely we can give a mathematical definition of the tangent line to a curve y = f (x) at a point P(x 0 , f (x 0 )) on the curve. As illustrated in Figure 2.1.1, the slope m PQ of the secant line through P and a second point Q(x, f (x)) on the graph of f is m PQ = f (x) − f (x 0 ) x − x 0 If we let x approach x 0 , then the point Q will move along the curve and approach the point P. Suppose the slope m PQ of the secant line through P and Q approaches a limit as x → x 0 . In that case we can take the value of the limit to be the slope m tan of the tangent line at P. Thus, we make the following definition. Figure 2.1.1 eBook - PDF
Calculus
Single Variable
- Deborah Hughes-Hallett, Andrew M. Gleason, William G. McCallum, Daniel E. Flath, Patti Frazer Lock, David O. Lomen, David Lovelock, Brad G. Osgood, Douglas Quinney, Karen R. Rhea, Jeff Tecosky-Feldman, Thomas W. Tucker, Otto K. Bretscher, Sheldon P. Gordon, Andrew Pasquale, Joseph Thrash(Authors)
- 2014(Publication Date)
- Wiley(Publisher)
2.2 THE DERIVATIVE AT A POINT Average Rate of Change In Section 2.1, we looked at the change in height divided by the change in time; this ratio is called the difference quotient. Now we define the rate of change of a function f that depends on a variable other than time. We say: Average rate of change of f over the interval from a to a + h = f (a + h) − f (a) h . The numerator, f (a + h) − f (a), measures the change in the value of f over the interval from a to a + h. The difference quotient is the change in f divided by the change in the independent variable, which we call x. Although the interval is no longer necessarily a time interval, we still talk about the average rate of change of f over the interval. If we want to emphasize the independent variable, we talk about the average rate of change of f with respect to x. Instantaneous Rate of Change: The Derivative We define the Instantaneous Rate of Change of a function at a point in the same way that we defined instantaneous velocity: we look at the average rate of change over smaller and smaller intervals. This Instantaneous Rate of Change is called the derivative of f at a, denoted by f ′ (a). The derivative of f at a, written f ′ (a), is defined as Rate of change of f at a = f ′ (a) = lim h→0 f (a + h) − f (a) h . If the limit exists, then f is said to be differentiable at a. To emphasize that f ′ (a) is the rate of change of f (x) as the variable x changes, we call f ′ (a) the derivative of f with respect to x at x = a. When the function y = s(t) represents the position of an object, the derivative s ′ (t) is the velocity. 86 Chapter Two KEY CONCEPT: THE DERIVATIVE Example 1 Eucalyptus trees, common in California and the Pacific Northwest, grow better with more water. Scientists in North Africa, analyzing where to plant trees, found that the volume of wood that grows on a square kilometer, in meters 3 , is approximated by 2 V (r) = 0.2r 2 − 20r + 600, where r is rainfall in cm per year, and 60 ≤ r ≤ 120. eBook - PDF
- Oscar E. Fernandez, Oscar Fernandez(Authors)
- 2019(Publication Date)
- Princeton University Press(Publisher)
Simplifying, canceling x , and evaluating the limit EXAMPLE 3.7 Find the equation of the tangent line at point ( 1, 1 ) on the graph of f ( x ) = x 3 . 50 • Derivatives: Change, Quantified Solution We just calculated the slope of that tangent line: f ( 1 ) = 3. It follows from the point–slope equation that the equation of the tangent line is: y − 1 = 3 ( x − 1 ) . Simplifying yields y = 3 x − 2, plotted in Figure 3.4(b). Related Exercises 1–9. Tips, Tricks, and Takeaways The definition of f ( a ) (Definition 3.2) looks like the definition of s ( a ) (Definition 3.1) but with different notation and terminology. Indeed, in the next section we’ll exploit these parallels to develop new, useful interpretations of f ( a ) . 3.3 The Instantaneous Rate of Change Interpretation of the Derivative ∆ y — ∆ x ∆ y — ∆ x ∆ d — ∆ t Average Instantaneous Rate of Change Speed lim ∆ x →0 f′ ( a ) = ∆ d — ∆ t lim ∆ t →0 Figure 3.5: The definition of the derivative is a gen-eralization of the definition of instantaneous speed. The workflow in Section 3.2 is very similar to that of Sec-tion 3.1. Figure 3.5 provides a visual comparison. In both cases, we first calculate the average rate of change of the function we’re interested in—distance in Section 3.1, a general function f in Section 3.2—over a certain interval x (or t ). Then, we find the limit of that average rate of change as x → 0 and get an Instantaneous Rate of Change. This interplay between instantaneous speed s ( a ) and f ( a ) yields the following insights: 1. The derivative at x = a, f ( a ) , measures the Instantaneous Rate of Change of f at x = a. 2. The instantaneous speed of an object at time t = a, s ( a ) , is the derivative of the object’s distance function d at t = a: s ( a ) = d ( a ) . 3. The units of the derivative at x = a, f ( a ) , are the ratio of the units of f ( x ) to the units of x. Insight 3 follows from the right-hand side of (3.8) being a ratio of changes in f ( x ) with changes in x . eBook - PDF
- David Pearson(Author)
- 1995(Publication Date)
- Butterworth-Heinemann(Publisher)
In this case, between times tl and t2 the object moves a distance (a + ut2) -(a + utI) == U(t2 -tI), and the value of u, the distance travelled per unit time, is the speed of the object, and remains constant. More generally, if s is not necessarily linear in t, we can define the instantaneous speed to be the rate of change of distance with respect to time. This (instantaneous) speed is just s' (t), the derivative with respect to time of the distance travelled. A more common notation is to write s(t) rather than s'(t). Thus s is the result of a limit in which we consider the ratio of distance travelled to time taken, over smaller and smaller time intervals. We have already introduced this kind of derivative earlier in the chapter. Graphically, if we plot distance travelled against time t, then the speed is the slope of the graph at a given value of t. It is often helpful to use coordinates in describing the motion of objects. Consider, for example, a point P moving along the x-axis, and let x == x(t) be the coordinate of the point as a function of time t. Here x(t) is the displacement of the point P from the origin 0 as a function of time. Note that, in contrast to the situation with respect to distance travelled, the displacement x( t) may be positive or negative, and may increase, decrease, or remain constant as t increases. The rate of change x(t) of displacement with respect to time is called the (instantaneous) velocity of the point P. If x is positive, then P is moving (instantaneously) to the right, and if x is negative then P is moving to the left. If x has the value zero for some value of t, then we say that the point P is instantaneously at rest. In Section 6.2 I shall discuss further the role of the sign of the derivative in determining the increase and decrease of functions. Of course 'instantaneous' here is the operative word. eBook - PDF
Applied Calculus
for Business, Life, and Social Sciences
- Denny Burzynski(Author)
- 2014(Publication Date)
- XYZ Textbooks(Publisher)
44 Chapter 1 Functions, Limits, and Rates of Change Solution To find the average rate of change in the surface area from r = 1 to r = 3, we find the slope of the line that passes through the points (1, S(1)) and (3, S(3)). Average rate of change = S(3) − S(1) __________ 3 − 1 = 4π . 3 2 − 4π . 1 2 _____________ 3 − 1 = 36π − 4π ________ 2 = 16π in 2 /in The surface area of the balloon increases an aver- age of 16π in 2 /in as the radius increases from 1 inch to 3 inches. Note that this is one situation in which reducing the units to in 2 /in = in makes the result less understandable. Difference Quotients and Average Rate of Change We can generalize the average rate of change of any function, and, at the same time, begin our work with a formula that is important in calculus. In the diagram below, the slope of the blue line (called a secant line) is the average rate of change of the red curve from point P to point Q. The slope of the line passing through the points P and Q is given by the following formula: Slope of line through P and Q = m = f (b ) − f (a) __________ b − a The expression f (b) − f (a) ______ b − a is called a difference quotient. It represents the average rate of change of the function f from the point (a, f (a)) to the point (b, f (b)). Throughout your study of calculus, you will see the difference quotient in a variety of forms. For instance, Example 8 uses the points (x 1 , y 1 ) and (x 2 , y 2 ) rather than (a, f (a)) and (b, f (b)). Either way, the difference quotient represents the slope of the secant line and the average rate of change between those points. Figure 6 r S(r) 100 50 150 200 1 2 3 4 S (3) - S(1) 3 - 1 Figure 7 x y y = f (x) P Q Run = b - a Rise = f (b) - f (a) a x f (b) f (a) b - a Rise Run m = Note A line that passes through two points on a graph is called a secant line. We will see much more of these lines in Section 1.6. eBook - PDF
- Deborah Hughes-Hallett, Andrew M. Gleason, Daniel E. Flath, Patti Frazer Lock, Sheldon P. Gordon, David O. Lomen, David Lovelock, William G. McCallum, Brad G. Osgood, Andrew Pasquale, Jeff Tecosky-Feldman, Joseph Thrash, Karen R. Rhea, Thomas W. Tucker(Authors)
- 2022(Publication Date)
- Wiley(Publisher)
Now we link this idea to derivatives. Analogous to the relative change, we look at the rate of change as a fraction of the original quantity. The relative rate of change of = () at = is defined to be Relative rate of change of at = ∕ = () () . We see in Section 3.3 that an exponential function has a constant relative rate of change. If the independent variable is time, the relative rate is often given as a percent change per unit time. Example 8 Annual world soybean production, 17 = (), in million tons, is a function of years since the start of 2010. (a) Interpret the statements (8) = 358 and (8) = 16 in terms of soybean production. (b) Calculate the relative rate of change of at = 8; interpret it in terms of soybean production. Solution (a) The statement (8) = 358 tells us that 358 million tons of soybeans were produced in the year 2018. The statement (8) = 16 tells us that in 2018 annual soybean production was increasing at a rate of 16 million tons per year. (b) We have Relative rate of change of soybean production = (8) (8) = 16 358 = 0.045. In 2018, annual soybean production was increasing at a continuous rate of 4.5% per year. 17 http://www.sopa.org/statistics/world-soybean-production, accessed March 31, 2021. 120 Chapter 2 RATE OF CHANGE: THE DERIVATIVE Example 9 Solar photovoltaic (PV) cells are the world’s fastest growing energy source. At time in years since 2018, peak PV energy-generating capacity worldwide was approximately = 512 0.24 gigawatts. 18 Estimate the relative rate of change of PV energy-generating capacity in 2022 using this model with (a) Δ = 1 (b) Δ = 0.1 (c) Δ = 0.01 Solution Let = (). In 2022 we have = 4. The relative rate of change of in 2022 is (4)∕ (4). We estimate (4) using a difference quotient. (a) Estimating the relative rate of change using Δ = 1 at = 4, we have ∕ = (4) (4) ≈ 1 (4) (5) − (4) 1 = 0.271 = 27.1% per year.
Index pages curate the most relevant extracts from our library of academic textbooks. They’ve been created using an in-house natural language model (NLM), each adding context and meaning to key research topics.