
eBook - ePub
Visualization Analysis and Design
Tamara Munzner
This is a test
Condividi libro
- 428 pagine
- English
- ePUB (disponibile sull'app)
- Disponibile su iOS e Android
eBook - ePub
Visualization Analysis and Design
Tamara Munzner
Dettagli del libro
Anteprima del libro
Indice dei contenuti
Citazioni
Informazioni sul libro
Learn How to Design Effective Visualization SystemsVisualization Analysis and Design provides a systematic, comprehensive framework for thinking about visualization in terms of principles and design choices. The book features a unified approach encompassing information visualization techniques for abstract data, scientific visualization techniques
Domande frequenti
Come faccio ad annullare l'abbonamento?
È semplicissimo: basta accedere alla sezione Account nelle Impostazioni e cliccare su "Annulla abbonamento". Dopo la cancellazione, l'abbonamento rimarrà attivo per il periodo rimanente già pagato. Per maggiori informazioni, clicca qui
È possibile scaricare libri? Se sì, come?
Al momento è possibile scaricare tramite l'app tutti i nostri libri ePub mobile-friendly. Anche la maggior parte dei nostri PDF è scaricabile e stiamo lavorando per rendere disponibile quanto prima il download di tutti gli altri file. Per maggiori informazioni, clicca qui
Che differenza c'è tra i piani?
Entrambi i piani ti danno accesso illimitato alla libreria e a tutte le funzionalità di Perlego. Le uniche differenze sono il prezzo e il periodo di abbonamento: con il piano annuale risparmierai circa il 30% rispetto a 12 rate con quello mensile.
Cos'è Perlego?
Perlego è un servizio di abbonamento a testi accademici, che ti permette di accedere a un'intera libreria online a un prezzo inferiore rispetto a quello che pagheresti per acquistare un singolo libro al mese. Con oltre 1 milione di testi suddivisi in più di 1.000 categorie, troverai sicuramente ciò che fa per te! Per maggiori informazioni, clicca qui.
Perlego supporta la sintesi vocale?
Cerca l'icona Sintesi vocale nel prossimo libro che leggerai per verificare se è possibile riprodurre l'audio. Questo strumento permette di leggere il testo a voce alta, evidenziandolo man mano che la lettura procede. Puoi aumentare o diminuire la velocità della sintesi vocale, oppure sospendere la riproduzione. Per maggiori informazioni, clicca qui.
Visualization Analysis and Design è disponibile online in formato PDF/ePub?
Sì, puoi accedere a Visualization Analysis and Design di Tamara Munzner in formato PDF e/o ePub, così come ad altri libri molto apprezzati nelle sezioni relative a Economics e Statistics for Business & Economics. Scopri oltre 1 milione di libri disponibili nel nostro catalogo.
Informazioni
Chapter 1
What’s Vis, and Why Do It?
1.1The Big Picture
This book is built around the following definition of visualization—vis, for short:
Computer-based visualization systems provide visual representations of datasets designed to help people carry out tasks more effectively.
Visualization is suitable when there is a need to augment human capabilities rather than replace people with computational decision-making methods. The design space of possible vis idioms is huge, and includes the considerations of both how to create and how to interact with visual representations. Vis design is full of trade-offs, and most possibilities in the design space are ineffective for a particular task, so validating the effectiveness of a design is both necessary and difficult. Vis designers must take into account three very different kinds of resource limitations: those of computers, of humans, and of displays. Vis usage can be analyzed in terms of why the user needs it, what data is shown, and how the idiom is designed.
I’ll discuss the rationale behind many aspects of this definition as a way of getting you to think about the scope of this book, and about visualization itself:
•Why have a human in the decision-making loop?
•Why have a computer in the loop?
•Why use an external representation?
•Why depend on vision?
•Why show the data in detail?
•Why use interactivity?
•Why is the vis idiom design space huge?
•Why focus on tasks?
•Why are most designs ineffective?
•Why care about effectiveness?
•Why is validation difficult?
•Why are there resource limitations?
•Why analyze vis?
1.2Why Have a Human in the Loop?
Vis allows people to analyze data when they don’t know exactly what questions they need to ask in advance.
The modern era is characterized by the promise of better decision making through access to more data than ever before. When people have well-defined questions to ask about data, they can use purely computational techniques from fields such as statistics and machine learning.★ Some jobs that were once done by humans can now be completely automated with a computer-based solution. If a fully automatic solution has been deemed to be acceptable, then there is no need for human judgement, and thus no need for you to design a vis tool. For example, consider the domain of stock market trading. Currently, there are many deployed systems for highfrequency trading that make decisions about buying and selling stocks when certain market conditions hold, when a specific price is reached, for example, with no need at all for a time-consuming check from a human in the loop. You would not want to design a vis tool to help a person make that check faster, because even an augmented human will not be able to reason about millions of stocks every second.
★ The field of machine learning is a branch of artificial intelligence where computers can handle a wide variety of new situations in response to datadriven training, rather than by being programmed with explicit instructions in advance.
However, many analysis problems are ill specified: people don’t know how to approach the problem. There are many possible questions to ask—anywhere from dozens to thousands or more—and people don’t know which of these many questions are the right ones in advance. In such cases, the best path forward is an analysis process with a human in the loop, where you can exploit the powerful pattern detection properties of the human visual system in your design. Vis systems are appropriate for use when your goal is to augment human capabilities, rather than completely replace the human in the loop.
You can design vis tools for many kinds of uses. You can make a tool intended for transitional use where the goal is to “work itself out of a job”, by helping the designers of future solutions that are purely computational. You can also make a tool intended for longterm use, in a situation where there is no intention of replacing the human any time soon.
For example, you can create a vis tool that’s a stepping stone to gaining a clearer understanding of analysis requirements before developing formal mathematical or computational models. This kind of tool would be used very early in the transition process in a highly exploratory way, before even starting to develop any kind of automatic solution. The outcome of designing vis tools targeted at specific real-world domain problems is often a much crisper understanding of the user’s task, in addition to the tool itself.
In the middle stages of a transition, you can build a vis tool aimed at the designers of a purely computational solution, to help them refine, debug, or extend that system’s algorithms or understand how the algorithms are affected by changes of parameters. In this case, your tool is aimed at a very different audience than the end users of that eventual system; if the end users need visualization at all, it might be with a very different interface. Returning to the stock market example, a higher-level system that determines which of multiple trading algorithms to use in varying circumstances might require careful tuning. A vis tool to help the algorithm developers analyze its performance might be useful to these developers, but not to people who eventually buy the software.
You can also design a vis tool for end users in conjunction with other computational decision making to illuminate whether the automatic system is doing the right thing according to human judgement. The tool might be intended for interim use when making deployment decisions in the late stages of a transition, for example, to see if the result of a machine learning system seems to be trustworthy before entrusting it to spend millions of dollars trading stocks. In some cases vis tools are abandoned after that decision is made; in other cases vis tools continue to be in play with long-term use to monitor a system, so that people can take action if they spot unreasonable behavior.
In contrast to these transitional uses, you can also design vis tools for long-term use, where a person will stay in the loop indefinitely. A common case is exploratory analysis for scientific discovery, where the goal is to speed up and improve a user’s ability to generate and check hypotheses. Figure 1.1 shows a vis tool designed to help biologists studying the genetic basis of disease through analyzing DNA sequence variation. Although these scientists make heavy use of computation as part of their larger workflow, there’s no hope of completely automating the process of cancer research any time soon.
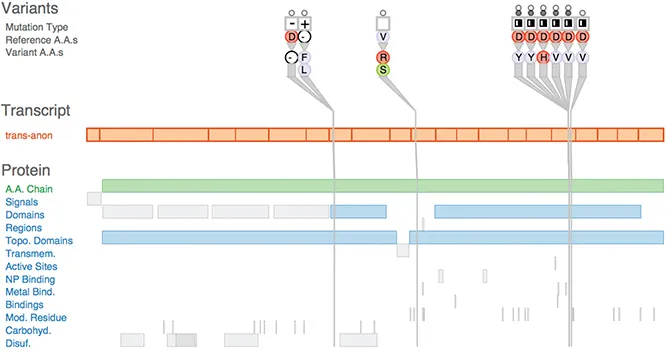
Figure 1.1. The Variant View vis tool supports biologists in assessing the impact of genetic variants by speeding up the exploratory analysis process. From [Ferstay et al. 13, Figure 1].
You can also design vis tools for presentation. In this case, you’re supporting people who want to explain something that they already know to others, rather than to explore and analyze the unknown. For example, The New York Times has deployed sophisticated interactive visualizations in conjunction with news stories.
1.3Why Have a Computer in the Loop?
By enlisting computation, you can build tools that allow people to explore or present large datasets that would be completely infeasible to draw by hand, thus opening up the possibility of seeing how datasets change over time.
People could create visual representations of datasets manually, either completely by hand with pencil and paper, or with computerized drawing tools where they individually arrange and color each item. The scope of what people are willing and able to do manually is strongly limited by their attention span; they are unlikely to move beyond tiny static datasets. Arranging even small datasets of hundreds of items might take hours or days. Most real-world datasets are much larger, ranging from thousands to millions to even more. Moreover, many datasets change dynamically over time. Having a computer-based tool generate the visual representation automatically obviously saves human effort compared to manual creation.
As a designer, you can think about what aspects of hand-drawn diagrams are important in order to automatically create drawings that retain the hand-drawn spirit. For example, Figure 1.2 shows an example of a vis tool designed to show interactions between genes in a way similar to stylized drawings that appear in biology textbooks, with vertical layers that correspond to the location within the cell where the interaction occurs [Barsky et al. 07]. Figure 1.2(a) could be done by hand, while Figure 1.2(b) could not.
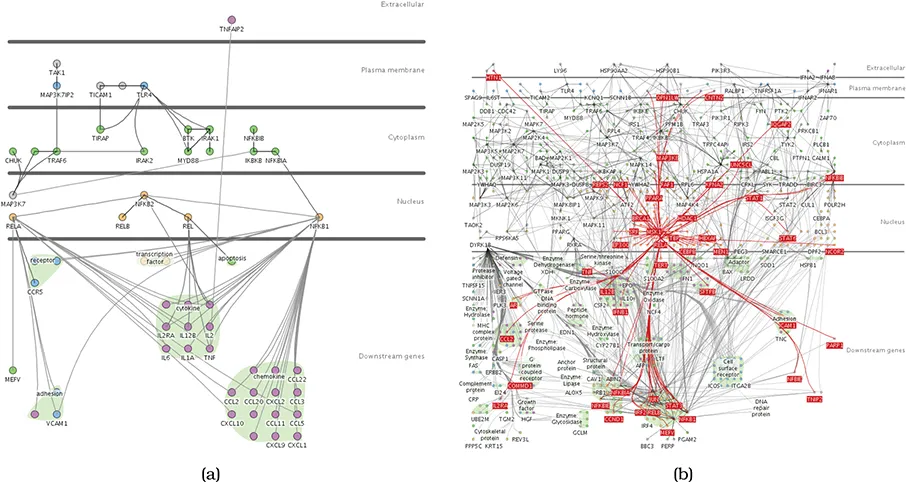
Figure 1.2. The Cerebral vis tool captures the style of hand-drawn diagrams in biology textbooks with vertical layers that correspond to places within a cell where interactions between genes occur. (a) A small network of 57 nodes and 74 edges might be possible to lay out by hand with enough patience. (b) Automatic layout handles this large network of 760 nodes and 1269 edges and provides a substrate for interactive exploration: the user has moved the mouse over the MSK1 gene, so all of its immmediate neighbors in the network are highlighted in red. From [Barsky et al. 07, Figures 1 and 2].