Data Science Bookcamp
Five real-world Python projects
Leonard Apeltsin
- 704 pagine
- English
- ePUB (disponibile sull'app)
- Disponibile su iOS e Android
Data Science Bookcamp
Five real-world Python projects
Leonard Apeltsin
Informazioni sul libro
Learn data science with Python by building five real-world projects! Experiment with card game predictions, tracking disease outbreaks, and more, as you build a flexible and intuitive understanding of data science. In Data Science Bookcamp you will learn: - Techniques for computing and plotting probabilities
- Statistical analysis using Scipy
- How to organize datasets with clustering algorithms
- How to visualize complex multi-variable datasets
- How to train a decision tree machine learning algorithm In Data Science Bookcamp you'll test and build your knowledge of Python with the kind of open-ended problems that professional data scientists work on every day. Downloadable data sets and thoroughly-explained solutions help you lock in what you've learned, building your confidence and making you ready for an exciting new data science career. Purchase of the print book includes a free eBook in PDF, Kindle, and ePub formats from Manning Publications. About the technology
A data science project has a lot of moving parts, and it takes practice and skill to get all the code, algorithms, datasets, formats, and visualizations working together harmoniously. This unique book guides you through five realistic projects, including tracking disease outbreaks from news headlines, analyzing social networks, and finding relevant patterns in ad click data. About the book
Data Science Bookcamp doesn't stop with surface-level theory and toy examples. As you work through each project, you'll learn how to troubleshoot common problems like missing data, messy data, and algorithms that don't quite fit the model you're building. You'll appreciate the detailed setup instructions and the fully explained solutions that highlight common failure points. In the end, you'll be confident in your skills because you can see the results. What's inside - Web scraping
- Organize datasets with clustering algorithms
- Visualize complex multi-variable datasets
- Train a decision tree machine learning algorithm About the reader
For readers who know the basics of Python. No prior data science or machine learning skills required. About the author
Leonard Apeltsin is the Head of Data Science at Anomaly, where his team applies advanced analytics to uncover healthcare fraud, waste, and abuse. Table of Contents
CASE STUDY 1 FINDING THE WINNING STRATEGY IN A CARD GAME
1 Computing probabilities using Python
2 Plotting probabilities using Matplotlib
3 Running random simulations in NumPy
4 Case study 1 solution
CASE STUDY 2 ASSESSING ONLINE AD CLICKS FOR SIGNIFICANCE
5 Basic probability and statistical analysis using SciPy
6 Making predictions using the central limit theorem and SciPy
7 Statistical hypothesis testing
8 Analyzing tables using Pandas
9 Case study 2 solution
CASE STUDY 3 TRACKING DISEASE OUTBREAKS USING NEWS HEADLINES
10 Clustering data into groups
11 Geographic location visualization and analysis
12 Case study 3 solution
CASE STUDY 4 USING ONLINE JOB POSTINGS TO IMPROVE YOUR DATA SCIENCE RESUME
13 Measuring text similarities
14 Dimension reduction of matrix data
15 NLP analysis of large text datasets
16 Extracting text from web pages
17 Case study 4 solution
CASE STUDY 5 PREDICTING FUTURE FRIENDSHIPS FROM SOCIAL NETWORK DATA
18 An introduction to graph theory and network analysis
19 Dynamic graph theory techniques for node ranking and social network analysis
20 Network-driven supervised machine learning
21 Training linear classifiers with logistic regression
22 Training nonlinear classifiers with decision tree techniques
23 Case study 5 solution
Domande frequenti
Informazioni
Part 1. Case study 1: Finding the winning strategy in a card game
Problem statement

Overview
-
Compute the probabilities of observable events using sample space analysis.
-
Plot the probabilities of events across a range of interval values.
-
Simulate random processes, such as coin flips and card shuffling, using Python.
-
Evaluate our confidence in decisions drawn from simulations using confidence interval analysis.
1 Computing probabilities using Python
- What are the basics of probability theory?
- Computing probabilities of a single observation
- Computing probabilities across a range of observations
1.1 Sample space analysis: An equation-free approach for measuring uncertainty in outcomes
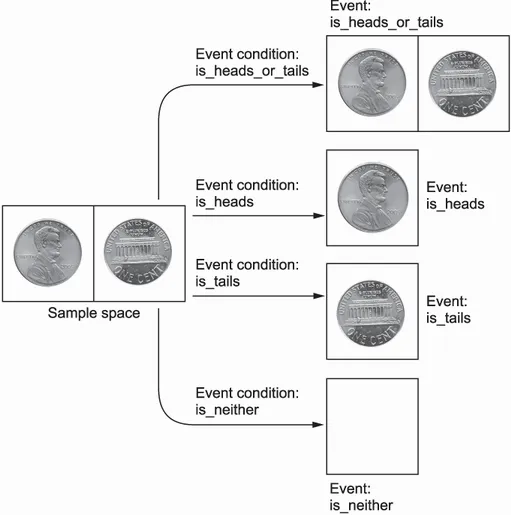
sample_space = {'Heads', 'Tails'} ❶ sample_space at random. What fraction of the time will the chosen element equal Heads? Well, our sample space holds two possible elements. Each element occupies an equal fraction of the space within the set. Therefore, we expect Heads to be selected with a frequency of 1/2. That frequency is formally defined as the probability of an outcome. All outcomes within sample_space share an identical probability, which is equal to 1 / len(sample_space).probability_heads = 1 / len(sample_space) print(f'Probability of choosing heads is {probability_heads}') Probability of choosing heads is 0.5 Heads equals 0.5. This relates directly to the action of flipping a coin. We’ll assume the coin is unbiased, which means the coin is equally likely to fall on either heads or tails. Thus, a coin flip is conceptually equivalent to choosing a random element from sample_space. The probability of the coin landing on heads is therefore 0.5; the probability of it landing on tails is also equal to 0.5.sample_space that satisfy some event condition (as shown in figure 1.1). An event condition is a simple Boolean function whose input is a single sample_space element. The function returns True only if the element satisfies our condition constraints.