Expect the Unexpected
eBook - ePub

Expect the Unexpected

A First Course in Biostatistics

Raluca Balan, Gilles Lamothe;;;

Condividi libro
  1. 316 pagine
  2. English
  3. ePUB (disponibile sull'app)
  4. Disponibile su iOS e Android
eBook - ePub

Expect the Unexpected

A First Course in Biostatistics

Raluca Balan, Gilles Lamothe;;;

Dettagli del libro
Anteprima del libro
Indice dei contenuti
Citazioni

Informazioni sul libro

-->

This textbook introduces the basic concepts from probability theory and statistics which are needed for statistical analysis of data encountered in the biological and health sciences. No previous study is required. Advanced mathematical tools, such as integration and differentiation, are kept to a minimum. The emphasis is put on the examples. Probabilistic methods are discussed at length, but the focus of this edition is on statistics.

The examples are kept simple, so that the reader can learn quickly and see the usefulness of various statistical and probabilistic methods. Some of the examples used in this book draw attention to various problems related to environmental issues, climate change, loss of bio-diversity, and their impact on wildlife and humans.

In comparison with the first edition of the book, this second edition contains additional topics such as power, sample size computation and non-parametric methods, and includes a large collection of new problems, as well as the answers to odd-numbered problems. Several sections of this edition are accompanied by instructions using the programming language R for statistical computing and graphics.

-->

Request Inspection Copy


--> Contents:

  • Probability:
    • Introduction to Probability
    • Axioms of Probability
    • Conditional Probability
    • Discrete Random Variables
    • Continuous Random Variables
    • Supplementary Problems (Probability)
  • Statistics:
    • Introduction to Statistics
    • Confidence Intervals
    • Hypothesis Testing
    • Comparison of Two Independent Samples
    • Paired Samples
    • Categorical Data
    • Regression and Correlation
    • Supplementary Problems (Statistics)
  • Additional Topics:
    • Sample Size and Power
    • Non-Parametric Methods
    • Answers to Odd-Numbered Problems
    • Tables

-->
--> Readership: Undergraduates studying probability and statistics, especially in the life and natural sciences. -->
Probability Theory;Statistical Inference;Biostatistics;Statistics;Calculus-Based Statistics;Genetics;Biology;Ecology;Health;Life Sciences;Natural Sciences Key Features:

  • This edition contains a large collection of new problems and includes the answers to odd-numbered problems
  • Several sections of the book are accompanied by a technology component containing instructions using the programming language R for statistical computing and graphics
  • Although probabilistic methods are discussed at length in the book, the focus of this edition is on statistics, with a new chapter dedicated to non-parametric methods in statistics

Domande frequenti

Come faccio ad annullare l'abbonamento?
È semplicissimo: basta accedere alla sezione Account nelle Impostazioni e cliccare su "Annulla abbonamento". Dopo la cancellazione, l'abbonamento rimarrà attivo per il periodo rimanente già pagato. Per maggiori informazioni, clicca qui
È possibile scaricare libri? Se sì, come?
Al momento è possibile scaricare tramite l'app tutti i nostri libri ePub mobile-friendly. Anche la maggior parte dei nostri PDF è scaricabile e stiamo lavorando per rendere disponibile quanto prima il download di tutti gli altri file. Per maggiori informazioni, clicca qui
Che differenza c'è tra i piani?
Entrambi i piani ti danno accesso illimitato alla libreria e a tutte le funzionalità di Perlego. Le uniche differenze sono il prezzo e il periodo di abbonamento: con il piano annuale risparmierai circa il 30% rispetto a 12 rate con quello mensile.
Cos'è Perlego?
Perlego è un servizio di abbonamento a testi accademici, che ti permette di accedere a un'intera libreria online a un prezzo inferiore rispetto a quello che pagheresti per acquistare un singolo libro al mese. Con oltre 1 milione di testi suddivisi in più di 1.000 categorie, troverai sicuramente ciò che fa per te! Per maggiori informazioni, clicca qui.
Perlego supporta la sintesi vocale?
Cerca l'icona Sintesi vocale nel prossimo libro che leggerai per verificare se è possibile riprodurre l'audio. Questo strumento permette di leggere il testo a voce alta, evidenziandolo man mano che la lettura procede. Puoi aumentare o diminuire la velocità della sintesi vocale, oppure sospendere la riproduzione. Per maggiori informazioni, clicca qui.
Expect the Unexpected è disponibile online in formato PDF/ePub?
Sì, puoi accedere a Expect the Unexpected di Raluca Balan, Gilles Lamothe;;; in formato PDF e/o ePub, così come ad altri libri molto apprezzati nelle sezioni relative a Matemáticas e Probabilidad y estadística. Scopri oltre 1 milione di libri disponibili nel nostro catalogo.

Informazioni

Editore
WSPC
Anno
2017
ISBN
9789813209084

PART 2

Statistics

Chapter 7

Introduction to Statistics

Statistics is one of the oldest disciplines in science, whose origins can be traced back to the 17th century when the British administration needed a tool for analyzing various demographic and economical data. The scope of the discipline became larger in the 19th century to include the analysis of data in general. Today, statistics is employed by people working in diverse fields, like economics, engineering, social sciences, and natural sciences.
In this chapter, we discuss several methods for analyzing data, using numerical summaries and graphical tools. We emphasize the distinction between a population and a random sample from a population. We explain how a random sample can be used to estimate population parameters, and discuss ways to measure the estimation error. Finally, we end this chapter with a discussion on the sampling distribution of estimators. We also give the Central Limit Theorem which states that the distribution of a sample mean can be approximated by a normal distribution.

7.1 Random Sampling and Data Description

In this section, we learn to describe data using numerical summaries (called descriptive statistics) and graphical representations. We consider the data as observations from a random variable. The set of these observations is called a random sample. The techniques that we use to describe the sample depend on the variable type.
If the values of the variable represent categories, then we say that the variable is categorical. The table below contains examples of categorical variables.
Variable Categories
color of pea pod yellow, green
type of fish Northern pike, Rainbow trout, Catfish
height small, medium, large
A variable is called quantitative (or numerical) if it represents a numerical quantity. Temperature (in Kelvin), surface area in (
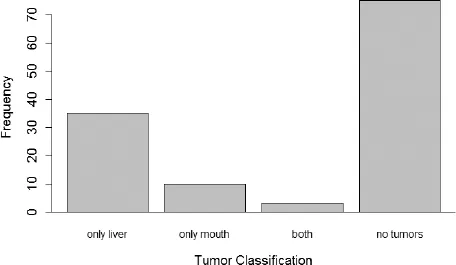
cm2), volume (in m3), height (in cm), and number of diseased individuals, are examples of quantitative variables.
For categorical variables an easy and effective way to describe the data is to display a frequency distribution or a relative frequency distribution. When defining the categories one has to be careful in defining mutually exclusive classes, otherwise the relative frequencies do not add up to 1. The (relative) frequency distribution can be displayed as a table, or graphically, as a bar chart.
Example 7.1. A fish tumor survey was conducted in a particular river system. Of particular interest were liver tumors and tumors in the mouth. A random sample of n = 123 fish were captured, classified and released. The frequency distribution is displayed below in tabular form and as a bar chart in Figure 7.1.
Tumor Classification
Frequency
Relative Frequency
only liver
35
28.5%
only mouth
10
8.1%
both
3
2.4%
no tumors
75
61.0%
Total
123
100%
Many biological studies are comparative in nature. These studies usually involve two or more variables. In the case of two categorical variables, we can start by cross-classifying the observations according to the joint categories of the two variables. The resulting table is called a contingency table and it displays the joint (relative) frequency distribution of the two variables.
To describe the association between the two variables, we can compute conditional relative frequency distributions for one of the variables conditioned on the categories of the other variables. The conditional relative frequency distribution can be displayed as a side-by-side bar chart.
images
Fig. 7.1 Distribution of fish tumors
Example 7.2. Consider a fish tumor survey similar to Example 7.1. We would like to compare the fish tumor distributions in two river systems. A summary of the data is found in the following contingency table, which is a cross-classification of the fish according to the tumor category and the river systems. Each cell represents a joint frequency. In the parenthesis, we computed the conditional relative frequency for the tumour variable conditioned on the river system.
images
In Figure 7.2, we find a side-by-side bar chart of the conditional distributions for tumor. The distribution of tumors do appear to be heterogeneous. In fact, it appears that fish from the second river system are more likely to have no tumors.
The frequency distribution is an important tool to describe the random sample from a quantitative variable. The frequency distribut...

Indice dei contenuti