Image Processing and Analysis
eBook - ePub

Image Processing and Analysis

A Primer

Georgy Gimel'farb, Patrice Delmas

Condividi libro
  1. 248 pagine
  2. English
  3. ePUB (disponibile sull'app)
  4. Disponibile su iOS e Android
eBook - ePub

Image Processing and Analysis

A Primer

Georgy Gimel'farb, Patrice Delmas

Dettagli del libro
Anteprima del libro
Indice dei contenuti
Citazioni

Informazioni sul libro

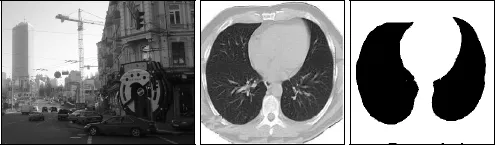
This textbook guides readers through their first steps into the challenging world of mimicking human vision with computational tools and techniques pertaining to the field of image processing and analysis. While today's theoretical and applied processing and analysis of images meet with challenging and complex problems, this primer is confined to a much simpler, albeit critical, collection of image-to-image transformations, including image normalisation, enhancement, and filtering.

It serves as an introduction to beginners, a refresher for undergraduate and graduate students, as well as engineers and computer scientists confronted with a problem to solve in computer vision. The book covers basic image processing/computer vision pipeline techniques, which are widely used in today's computer vision, computer graphics, and image processing, giving the readers enough knowledge to successfully tackle a wide range of applied problems.


Contents:

  • Preface
  • About the Authors
  • Continuous and Digital Images
  • Transforming Appearance
  • Filtering to Denoise or Enhance
  • Filtering to Segment
  • Morphological Filtering
  • Deforming Boundaries to Segment
  • Filtering to Find Points-of-Interest
  • Transforming Image Plane
  • Spectra and Spectral Filtering
  • Appendices:
    • Further Reading
    • Symbols and Math Notation
    • Abbreviations
  • Bibliography
  • Index


Readership: Advanced undergraduates and graduate students in science, engineering, environmental science, life sciences/biology and medicine. Engineers and scientists in need of a refresher or an introduction to image processing/computer vision.
Key Features:

  • Written for beginners as introduction to image processing covering noices filtering, segmentation, and image transformation
  • Supported with a wide range of case examples, demonstrate how computer pipeline techniques are used to solve the problems

Domande frequenti

Come faccio ad annullare l'abbonamento?
È semplicissimo: basta accedere alla sezione Account nelle Impostazioni e cliccare su "Annulla abbonamento". Dopo la cancellazione, l'abbonamento rimarrà attivo per il periodo rimanente già pagato. Per maggiori informazioni, clicca qui
È possibile scaricare libri? Se sì, come?
Al momento è possibile scaricare tramite l'app tutti i nostri libri ePub mobile-friendly. Anche la maggior parte dei nostri PDF è scaricabile e stiamo lavorando per rendere disponibile quanto prima il download di tutti gli altri file. Per maggiori informazioni, clicca qui
Che differenza c'è tra i piani?
Entrambi i piani ti danno accesso illimitato alla libreria e a tutte le funzionalità di Perlego. Le uniche differenze sono il prezzo e il periodo di abbonamento: con il piano annuale risparmierai circa il 30% rispetto a 12 rate con quello mensile.
Cos'è Perlego?
Perlego è un servizio di abbonamento a testi accademici, che ti permette di accedere a un'intera libreria online a un prezzo inferiore rispetto a quello che pagheresti per acquistare un singolo libro al mese. Con oltre 1 milione di testi suddivisi in più di 1.000 categorie, troverai sicuramente ciò che fa per te! Per maggiori informazioni, clicca qui.
Perlego supporta la sintesi vocale?
Cerca l'icona Sintesi vocale nel prossimo libro che leggerai per verificare se è possibile riprodurre l'audio. Questo strumento permette di leggere il testo a voce alta, evidenziandolo man mano che la lettura procede. Puoi aumentare o diminuire la velocità della sintesi vocale, oppure sospendere la riproduzione. Per maggiori informazioni, clicca qui.
Image Processing and Analysis è disponibile online in formato PDF/ePub?
Sì, puoi accedere a Image Processing and Analysis di Georgy Gimel'farb, Patrice Delmas in formato PDF e/o ePub, così come ad altri libri molto apprezzati nelle sezioni relative a Informatique e Médias numériques. Scopri oltre 1 milione di libri disponibili nel nostro catalogo.

Informazioni

Anno
2018
ISBN
9781786345837

Chapter 1

Continuous and Digital Images

To begin our journey through a vast land of image processing and analysis, it is natural to define main objects of interest: images of realistic or artificial objects and maps of regions or features exemplified in Fig. 1.1.
images
Fig. 1.1Realistic urban scene and a computed tomographic chest slice with its region map (black/white encoding of lung/background labels).
What will you find here? This chapter presents basic notions associated with continuous images and maps, as well as with their discrete (digital) analogues. Section 1.1 will detail spatial resolution of digitisation (sampling), the smallest discrete elements (points), called pixels in 2D or voxels in 3D digital images, and point-wise scalar or vectorial signals, in particular, grey values and colours in the images or region labels and numerical feature values in the maps.
Sections 1.2 and 1.3 describe a few features, or quantitative descriptors of global (image-wide) or local (point- and window-wide) signal behaviour. The descriptors include global brightness and contrast, as well as global or local statistical properties, called simply statistics, of signal co-occurrences in pixel or voxel k-tuples. The size, k, and spatial shapes of these signal patterns are mostly prescribed, but generally might depend on the signals. The first-order statistics follow from a global or local grey level histogram (GLH) and its cumulative histogram (CH). The second-order statistics follow from grey level difference or co-occurrence histograms (GLDH or GLCH, respectively) characterising prescribed or adaptively chosen signal pairs. This primer will consider only most common first- and second-order statistics, as well as briefly outlining popular higher-order ones, called local binary and ternary patterns (LBPs and LTPs).
Human vision is of great importance in perceiving, describing, and understanding the surrounding world. Our eyes receive electromagnetic waves reflected from or emitted by an observed (and thus called optical) spatial surface. The visible light has wavelengths from 0.4 to 0.7 μm (micrometers, or microns), sensed as colours from violet to red, respectively. Special optical sensors help to visualise certain ranges of ultraviolet (UV: 0.01 – 0.4 μm) and infrared light (IR: 0.7–1,000 μm). By various estimates, up to 35–50% of the human brain participate, in one way or another, in processing and analysing optical data acquired by multiple light receptors (cones and rods) in retinas of both eyes.
The eyes are constantly scanning their fields of view using rapid instinctive and slower deliberate movements, guided by observation goals. Sequences of retinal neural signals encoding the data acquired are compressed firstly in the retinas and then secondly by other vision-related parts of the brain in order to be combined at each time instant into a stable continuous image of the currently observed three-dimensional (3D) scene. The image perceived may be considered similar in many aspects to a central projection of the observed optical surfaces onto a 2D plane.
Older photo and cinematographic cameras with light-sensitive films produced continuous images with a continuous range of optical signals (grey shades or colours) encoding the perceived light. A majority of other imaging tools, including modern digital photo cameras and even the human eye retina (due to its limited spatial, intensity, and colour resolution), capture a finite set of isolated 2D image elements and mostly distinguish among a finite number of element-wise shades or colours.
Special imaging devices can visualise inner structures of realistic 3D objects, such as, e.g., human bodies, industrial parts, or soil samples to mention only a few, with the aid of penetrating magnetic fields or electromagnetic rays with wavelengths below 0.01 μm (X-rays). The latter are used in conventional X-ray radioscopy and computed tomography (CT), whereas the combination of strong static and pulsing magnetic fields enable magnetic resonance imaging (MRI). Radioscopic 2D images encode integral attenuations of multiple X-rays passing through an object, and 3D CT images or MRI encode point-...

Indice dei contenuti