The Handbook of Technical Analysis + Test Bank
eBook - ePub

The Handbook of Technical Analysis + Test Bank

The Practitioner's Comprehensive Guide to Technical Analysis

Mark Andrew Lim

Condividi libro
  1. English
  2. ePUB (disponibile sull'app)
  3. Disponibile su iOS e Android
eBook - ePub

The Handbook of Technical Analysis + Test Bank

The Practitioner's Comprehensive Guide to Technical Analysis

Mark Andrew Lim

Dettagli del libro
Anteprima del libro
Indice dei contenuti
Citazioni

Informazioni sul libro

A self study exam preparatory guide for financial technical analysis certifications

Written by the course director and owner of www.tradermasterclass.com, a leading source of live and online courses in trading, technical analysis, and money management, A Handbook of Technical Analysis: The Practitioner's Comprehensive Guide to Technical Analysis is the first financial technical analysis examination preparatory book in the market. It is appropriate for students taking IFTA CFTe Level I and II (US), STA Diploma (UK), Dip TA (Aus), and MTA CMT Level I, II, and III exams in financial technical analysis, as well as for students in undergraduate, graduate, or MBA courses.

The book is also an excellent resource for serious traders and technical analysts, and includes a chapter dedicated to advanced money management techniques. This chapter helps complete a student's education and also provides indispensable knowledge for FOREX, bond, stock, futures, CFD, and option traders.

  • Learn the definitions, concepts, application, integration, and execution of technical-based trading tools and approaches
  • Integrate innovative techniques for pinpointing and handling market reversals
  • Understand trading mechanisms and advanced money management techniques
  • Examine the weaknesses of popular technical approaches and find more effective solutions

The book allows readers to test their current knowledge and then check their learning with end-of-chapter test questions that span essays, multiple choice, and chart-based annotation exercises. This handbook is an essential resource for students, instructors, and practitioners in the field. Alongside the handbook, the author will also publish two full exam preparatory workbooks and a bonus online Q&A Test bank built around the most popular professional examinations in financial technical analysis.

Domande frequenti

Come faccio ad annullare l'abbonamento?
È semplicissimo: basta accedere alla sezione Account nelle Impostazioni e cliccare su "Annulla abbonamento". Dopo la cancellazione, l'abbonamento rimarrà attivo per il periodo rimanente già pagato. Per maggiori informazioni, clicca qui
È possibile scaricare libri? Se sì, come?
Al momento è possibile scaricare tramite l'app tutti i nostri libri ePub mobile-friendly. Anche la maggior parte dei nostri PDF è scaricabile e stiamo lavorando per rendere disponibile quanto prima il download di tutti gli altri file. Per maggiori informazioni, clicca qui
Che differenza c'è tra i piani?
Entrambi i piani ti danno accesso illimitato alla libreria e a tutte le funzionalità di Perlego. Le uniche differenze sono il prezzo e il periodo di abbonamento: con il piano annuale risparmierai circa il 30% rispetto a 12 rate con quello mensile.
Cos'è Perlego?
Perlego è un servizio di abbonamento a testi accademici, che ti permette di accedere a un'intera libreria online a un prezzo inferiore rispetto a quello che pagheresti per acquistare un singolo libro al mese. Con oltre 1 milione di testi suddivisi in più di 1.000 categorie, troverai sicuramente ciò che fa per te! Per maggiori informazioni, clicca qui.
Perlego supporta la sintesi vocale?
Cerca l'icona Sintesi vocale nel prossimo libro che leggerai per verificare se è possibile riprodurre l'audio. Questo strumento permette di leggere il testo a voce alta, evidenziandolo man mano che la lettura procede. Puoi aumentare o diminuire la velocità della sintesi vocale, oppure sospendere la riproduzione. Per maggiori informazioni, clicca qui.
The Handbook of Technical Analysis + Test Bank è disponibile online in formato PDF/ePub?
Sì, puoi accedere a The Handbook of Technical Analysis + Test Bank di Mark Andrew Lim in formato PDF e/o ePub, così come ad altri libri molto apprezzati nelle sezioni relative a Business e Finanza. Scopri oltre 1 milione di libri disponibili nel nostro catalogo.

Informazioni

Editore
Wiley
Anno
2015
ISBN
9781118498927
Edizione
1
Argomento
Business
Categoria
Finanza

CHAPTER 1
Introduction to the Art and Science of Technical Analysis

LEARNING OBJECTIVES

After studying this chapter, you should be able to:
  • Understand the key concepts underlying technical analysis
  • Identify the different forms of chart analysis
  • Describe the objectives of technical analysis
  • Understand what subjectivity means in technical analysis
  • Recognize the strengths and weaknesses of technical analysis
  • Categorize market participants according to style and time in markets
  • Identify the various styles and approaches in technical analysis
Technical analysis is a fascinating field of study. It is as much science as it is art. Its main strength is that a lot of it is visual, giving practitioners a better feel of the underlying dynamics of the markets. We shall also be looking at the various challenges to technical analysis, their resolution, and how technical analysis affects trading in general. The classification of technical approaches, market participants, and various markets will also be discussed in detail.

1.1 MAIN OBJECTIVE OF TECHNICAL ANALYSIS

It is generally accepted that human beings are born with certain instincts, tempered and molded by evolution via the passing of time. Every human being strives and seeks to fulfill these powerful instinctive forces.
The three main motivational instincts are:
  1. The instinct to survive
  2. The instinct for comfort
  3. The instinct to propagate
The instinct to survive is probably the strongest and most overpowering. Survival almost always precedes the need for comfort or to propagate the species. The instinct to survive includes:
  • The instinct to stay alive
  • The instinct to satisfy hunger
  • The instinct to seek safety, that is, being in a group/herd
  • The instinct to avoid danger (by having natural fears like the fear of fire, loud sounds, heights, etc.)
This powerful instinct to survive is the main driving force in life for striving to make a profit. But in order to make a profit to ensure continued survival, there must be a positive change in the actual or perceived value of something that we own. This change in value of some variable may be anything that will allow us to profit from change. One very popular and convenient variable of change is price. We can participate in this price change by satisfying a very simple mechanical rule that will ensure profitability every single time, which is to always buy when prices are low and sell when they are higher, popularly referred to as the buy low, sell high principle. See Figure 1.1.
images
Figure 1.1 The Mechanics of Profiting from a Change.
Unfortunately, in order to satisfy this simple rule of guaranteed profitability, we need to be able to do more of one thing, which is to be able to determine the direction of price ahead of time in order to know exactly when to buy low and subsequently sell higher. Hence, it is not only the mechanical action of buying low and selling high that counts, but also the timing of the action itself that is critical. This introduces an element of chance or probability into an otherwise fairly straightforward mechanical venture. Profitability therefore requires effective and efficient action in two dimensions, that is, price and time. Traders and analysts keep track of this action using a two-dimensional visualization tool, that is, a price-time chart, which tracks price on the vertical axis and time on horizontal axis.
In short, the ability to forecast or predict price or market action in a reasonably accurate fashion represents one of the skills that may be critical for longer-term success as a professional trader or analyst.

1.2 DUAL FUNCTION OF TECHNICAL ANALYSIS

Technical analysis essentially serves two main functions:
  1. For Identification: It identifies and describes past and present price action. It serves as a historical record of what has transpired in the markets. It provides a descriptive representation of market action. This allows the market practitioner to observe how the market has performed in the past, which includes its average volatility over a specified period; its highest and lowest historical price extremes; the common areas of consolidation, average duration, and price excursion of trends; the amount of liquidity and participation in the markets; the average degree and frequency of price gapping; the impact of various monetary economic announcements on price, and so on. This information is especially critical prior to any investment or trading decision.
  2. For Forecasting: Once a particular price or market action is identified, the practitioner may now use this information to interpret what the data actually means before inferring future price action. This inference about potential price action is wholly based on the assumption that price patterns are repetitive to some reasonable degree and therefore may be used as a basis for price predictions.

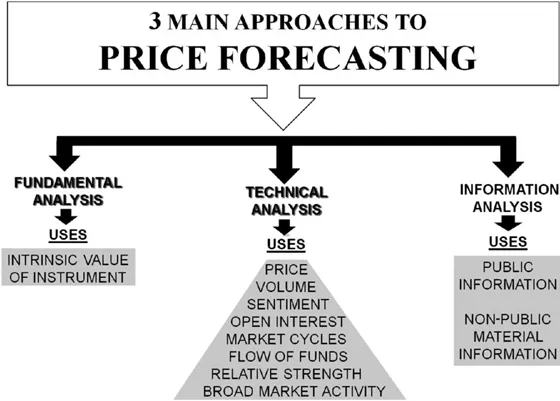
1.3 FORECASTING PRICE AND MARKET ACTION

There are three main approaches to predicting potential future price action or behavior, namely via:
  1. Fundamental Analysis
  2. Technical Analysis
  3. Information Analysis
See Figure 1.2.
images
Figure 1.2 Three Approaches to Price Forecasting.

Forecasting Stock Prices Using Fundamental Analysis

One way to gauge the potential price of a stock is by analyzing the company’s performance via its financial statements and accounts in order to determine its intrinsic value or the worth of the security in light of all its holdings, debt, earnings, dividends, income and balance sheet activity, cash flow, and so on. This accounting information is normally represented in ratio form, as in price to earnings (P/E), price to earnings growth (PEG), price to book, price to sales, and debt to equity ratios, to name but a few.
The logic is that a strongly performing company should continue to perform well into the future and garner more demand from investors excited to participate in the expected capital gains derived from the stock’s price and appreciating dividend yields. The price of a stock is expected to rise if there are sufficient buyers, signifying a demand for it. Conversely, the price of a stock is expected to decline if there are sufficient sellers, signifying an oversupply in the stock. Demand is potentially generated if the current stock price is below its estimated intrinsic value, that is, it is currently undervalued or underpriced, whereas ...

Indice dei contenuti