Multivariate Time Series Analysis
eBook - ePub

Multivariate Time Series Analysis

With R and Financial Applications

Ruey S. Tsay

Share book
  1. English
  2. ePUB (mobile friendly)
  3. Available on iOS & Android
eBook - ePub

Multivariate Time Series Analysis

With R and Financial Applications

Ruey S. Tsay

Book details
Book preview
Table of contents
Citations

About This Book

An accessible guide to the multivariate time series tools used in numerous real-world applications

Multivariate Time Series Analysis: With R and Financial Applications is the much anticipated sequel coming from one of the most influential and prominent experts on the topic of time series. Through a fundamental balance of theory and methodology, the book supplies readers with a comprehensible approach to financial econometric models and their applications to real-world empirical research.

Differing from the traditional approach to multivariate time series, the book focuses on reader comprehension by emphasizing structural specification, which results in simplified parsimonious VAR MA modeling. Multivariate Time Series Analysis: With R and Financial Applications utilizes the freely available R software package to explore complex data and illustrate related computation and analyses. Featuring the techniques and methodology of multivariate linear time series, stationary VAR models, VAR MA time series and models, unitroot process, factor models, and factor-augmented VAR models, the book includes:

ā€¢ Over 300 examples and exercises to reinforce the presented content

ā€¢ User-friendly R subroutines and research presented throughout to demonstrate modern applications

ā€¢ Numerous datasets and subroutines to provide readers with a deeper understanding of the material

Multivariate Time Series Analysis is an ideal textbook for graduate-level courses on time series and quantitative finance and upper-undergraduate level statistics courses in time series. The book is also an indispensable reference for researchers and practitioners in business, finance, and econometrics.

Frequently asked questions

How do I cancel my subscription?
Simply head over to the account section in settings and click on ā€œCancel Subscriptionā€ - itā€™s as simple as that. After you cancel, your membership will stay active for the remainder of the time youā€™ve paid for. Learn more here.
Can/how do I download books?
At the moment all of our mobile-responsive ePub books are available to download via the app. Most of our PDFs are also available to download and we're working on making the final remaining ones downloadable now. Learn more here.
What is the difference between the pricing plans?
Both plans give you full access to the library and all of Perlegoā€™s features. The only differences are the price and subscription period: With the annual plan youā€™ll save around 30% compared to 12 months on the monthly plan.
What is Perlego?
We are an online textbook subscription service, where you can get access to an entire online library for less than the price of a single book per month. With over 1 million books across 1000+ topics, weā€™ve got you covered! Learn more here.
Do you support text-to-speech?
Look out for the read-aloud symbol on your next book to see if you can listen to it. The read-aloud tool reads text aloud for you, highlighting the text as it is being read. You can pause it, speed it up and slow it down. Learn more here.
Is Multivariate Time Series Analysis an online PDF/ePUB?
Yes, you can access Multivariate Time Series Analysis by Ruey S. Tsay in PDF and/or ePUB format, as well as other popular books in Mathematics & Probability & Statistics. We have over one million books available in our catalogue for you to explore.

Information

Publisher
Wiley
Year
2013
ISBN
9781118617755
Edition
1

CHAPTER 1

Multivariate Linear Time Series

1.1 INTRODUCTION
Multivariate time series analysis considers simultaneously multiple time series. It is a branch of multivariate statistical analysis but deals specifically with dependent data. It is, in general, much more complicated than the univariate time series analysis, especially when the number of series considered is large. We study this more complicated statistical analysis in this book because in real life decisions often involve multiple inter-related factors or variables. Understanding the relationships between those factors and providing accurate predictions of those variables are valuable in decision making. The objectives of multivariate time series analysis thus include
1. To study the dynamic relationships between variables
2. To improve the accuracy of prediction
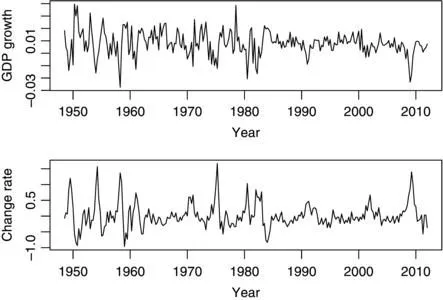
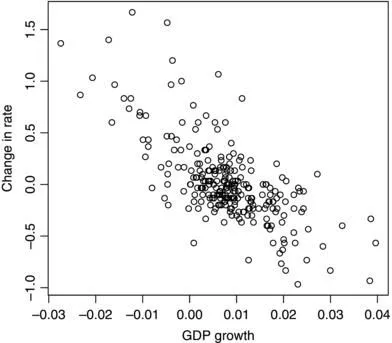
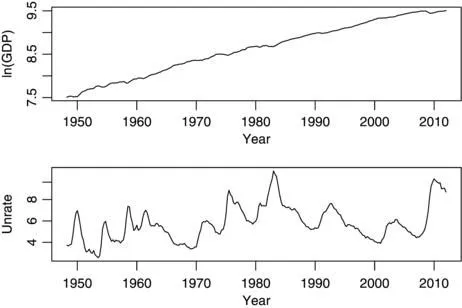
Let zt = (z 1t , āˆ™āˆ™āˆ™, zkt )ā€² be a k-dimensional time series observed at equally spaced time points. For example, let z 1t be the quarterly U.S. real gross domestic product (GDP) and z 2t the quarterly U.S. civilian unemployment rate. By studying z 1t and z 2t jointly, we can assess the temporal and contemporaneous dependence between GDP and unemployment rate. In this particular case, k = 2 and the two variables are known to be instantaneously negatively correlated. Figure 1.1 shows the time plots of quarterly U.S. real GDP (in logarithm of billions of chained 2005 dollars) and unemployment rate, obtained via monthly data with averaging, from 1948 to 2011. Both series are seasonally adjusted. Figure 1.2 shows the time plots of the real GDP growth rate and the changes in unemployment rate from the second quarter of 1948 to the fourth quarter of 2011. Figure 1.3 shows the scatter plot of the two time series given in Figure 1.2. From these figures, we can see that the GDP and unemployment rate indeed have negative instantaneous correlation. The sample correlation is āˆ’0.71.
FIGURE 1.1 Time plots of U.S. quarterly real GDP (in logarithm) and unemployment rate from 1948 to 2011. The data are seasonally adjusted.
image
FIGURE 1.2 Time plots of the growth rate of U.S. quarterly real GDP (in logarithm) and the change series of unemployment rate from 1948 to 2011. The data are seasonally adjusted.
image
FIGURE 1.3 Scatter plot of the changes in quarterly U.S. unemployment rate versus the growth rate of quarterly real GDP (in logarithm) from the second quarter of 1948 to the last quarter of 2011. The data are seasonally adjusted.
image
As another example, consider k = 3. Let z 1t be the monthly housing starts of the New England division in the United States, and z 2t and z 3t be the monthly housing starts of the Middle Atlantic division and the Pacific division, respectively. By considering the three series jointly, we can investigate the relationships between the housing markets of the three geographical divisions in the United States. Figure 1.4 shows the time plots of the three monthly housing starts from January 1995 to June 2011. The data are not seasonally adjusted so that there exists a clear seasonal cycle in the series. From the plots, the three series show certain similarities as well as some marked differences. In some applications, we consider large k. For instance, let zt be the monthly unemployment rates of the 50 states in the United States. Figure 1.5 shows the time plots of the monthly unemployment rates of the 50 states from January 1976 to September 2011. The data are seasonally adjusted. Here, k = 50 and plots are not particularly informative except that the series have certain common behavior. The objective of considering these series simultaneously may be to obtain predictions for the state unemployment rates. Such forecasts are important to state and local governments. In this particular instance, pooling informa...

Table of contents