![]()
Part I
Basic background
![]()
1 History and consumption trends
Ramesh C. Chandan
Global Technologies, Inc., Coon Rapids, Minnesota, USA
1.1 Overview of the world dairy industry
According to the UN Food and Agriculture Organization (FAO, 2011), the world production of milk in 2009 was 701.4 million metric tons (MT). This was estimated to increase to 713.6 million MT in 2010 and to 727.6 million MT in 2011. India is the largest producer of milk (including milk of cows and water buffaloes) in the world, with an estimated 121.7 million MT in the year 2011.
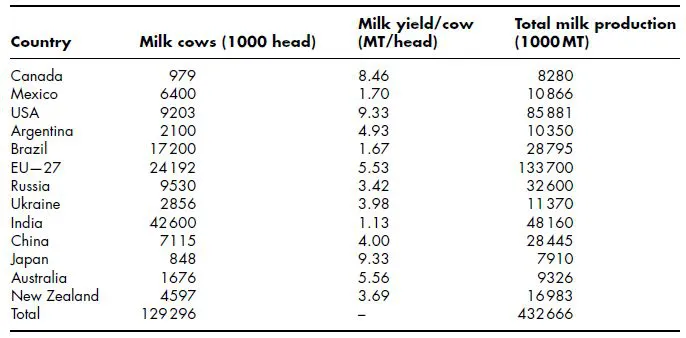
The 2009 world production of cow milk in the selected countries shown in Table 1.1 was 432.7 million MT. The documented number of cows was 129 296 thousand heads. Individual cow-milk yield varies widely around the world. In 2009, the USA and Japan were the most efficient milk producers, with 9.33 MT/cow, followed by Canada, with a yield of 8.46 MT per cow. Milk yield was lowest in India (1.13 MT/head), followed by Brazil (1.67 MT/head) and Mexico (1.70 MT/head).
1.2 Milk production in the USA
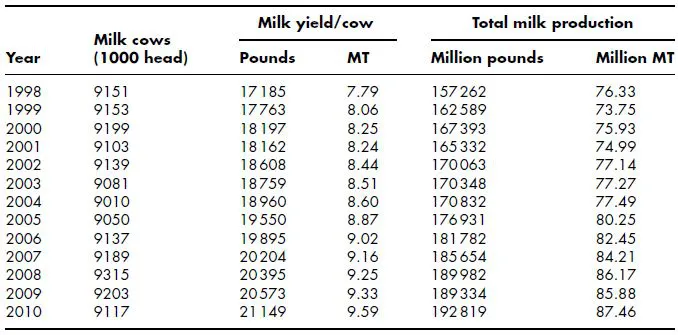
The trend in the last decade indicates a noticeable decrease in dairy-cow population, from 9.151 million heads in the year 1998 to 9.117 million heads in 2010 (Table 1.2). In the year 2010, 9.117 million cows produced 87.46 million MT (192 819 million pounds) of milk (IDFA, 2011). Table 1.2 also shows that during the period 1998–2010 there is a steady increase in milk production per cow, from 7.79 MT (17 185 pounds) to 9.59 MT (21 149 pounds). Concomitantly, milk production in the USA registered an increase from 76.33 million MT (157 262 million pounds) to 87.46 million MT (192 819 million pounds). Approximately 20% of the world’s milk is produced in the USA. The American dairy farm has been able to achieve its current milk output through the application of scientific and management advancements in milk production. On the dairy farm, selection of dairy cows, their breeding, and judicious use of balanced feed rations have been instrumental in increasing milk output per cow. As a result of continuous efficiencies in milk production at the farm, milk production per cow has doubled in the last 30 years. California continues to be the leading milk-producer state, followed by Wisconsin, New York, Idaho and Pennsylvania.
Table 1.1 World milk production in 2009. Adapted from USDA (2011a) and DairyCo (2011).
Table 1.2 Milk production in the USA. Adapted from IDFA (2011).
1.3 Production of dairy foods in the USA
At dairy farms, modern milking and milk-handling equipment, including automated milking systems, have improved the speed of cleaning, sanitizing, cooling and delivering good-quality raw milk to processing plants. The USA has the distinction of being the largest processor of milk and dairy products in the world. Advanced processing and packaging technologies ensure efficient delivery and a long shelf-life of high-quality milk products, including yogurt and fermented milks. Currently, the US dairy industry is valued at 110 billion US dollars (USD). Approximately 30% of the US milk produced on the farm is processed into fluid milk and cream products (Schultz, 2011b). Fluid milk products include whole milk (3.25% fat), reduced-fat milk (2% fat), low-fat milk (1% fat), nonfat milk (<0.5% fat), half and half (10.5 to <18% fat), light cream (18 to <30% fat), light whipping cream (30 to <36% fat), heavy cream (not less than 36% fat), cultured milk (3.25% fat), cultured reduced-fat milk (2% fat), cultured low-fat milk (1% fat), cultured nonfat milk (<0.5% fat) (cultured buttermilk), yogurt (3.25% fat), reduced-fat yogurt (2% fat), low-fat yogurt (1% fat), nonfat yogurt (<0.5% fat) and cottage cheese (4, 2, 1 or <0.5% fat).
The remaining 70% of farm milk is used in dairy manufacturing plants, where it is transformed into more than 300 varieties and styles of cheese, 100 flavors of ice cream, frozen desserts and frozen yogurt. In addition, dairy plants produce an array of flavored milk, ranging from fat-free to full-fat, butter, sweetened condensed milk, evaporated milk, dry milk, lactose, whey products and cultured products such as sour cream and dips, buttermilk and yogurt drinks/smoothies. According to Schultz (2011a), Wisconsin has the most dairy plants (210), followed by New York state (108) and California (106). The dairy-processing industry has demonstrated several packaging and marketing innovations in competing aggressively for consumer food dollar share.
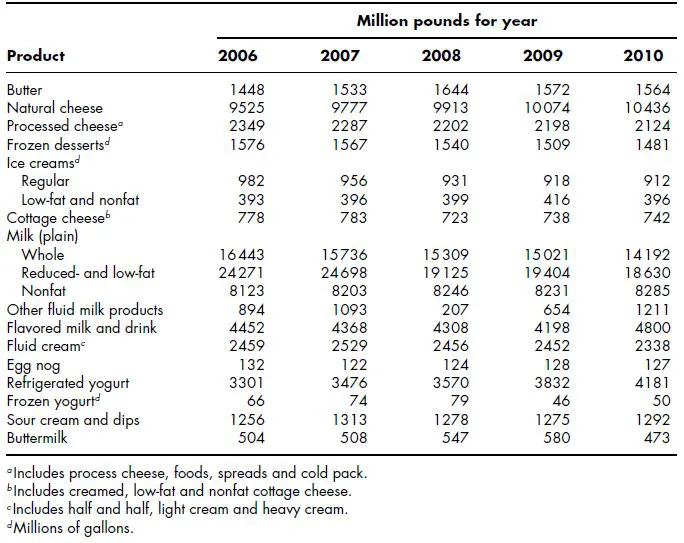
The products manufactured in the years 2006–2010 and their volumes are shown in Table 1.3. Butter production increased from 0.66 million MT (1448 million pounds) to 0.71 million MT (1564 million pounds), whereas natural cheese registered an increase from 4.32 million MT (9525 million pounds) to 4.73 million MT (10 436 million pounds). Process cheese declined from 1.06 million MT (2349 million pounds) to 0.96 million MT (2124 million pounds). Frozen desserts, including ice cream, whole milk, reduced-fat and low-fat milk, fluid cream and egg nog showed a decline. Nonfat milk and flavored milks showed some increase in volume. In the fermented-dairy-products category, refrigerated yogurt displayed explosive growth, from 1.50 million MT (3301 million pounds) in 2006 to 1.90 million MT (4181 million pounds) in 2010. However, sour cream and dips showed a relatively steady production volume (0.57 million MT (1256 million pounds) to 0.59 million MT (1292 million pounds)), whereas buttermilk production declined from 0.23 million MT (504 million pounds) to 0.21 million MT (473 million pounds).
During 2001–2006, per capita consumption of skim milk, 2% milk and whole milk declined slightly. In 2008, whole-milk consumption per capita was 22.9 kg (50.7 pounds), followed by 28.5 kg (62.9 pounds) for 2% milk, 10.2 kg (22.4 pounds) for 1% milk and 12.3 kg (27.1 pounds) for nonfat milk (Schultz, 2011b). Compared to the previous year, the 2010 total sales of conventional fluid milks declined by 1.8%. Whole-milk sales fell by 5.4%, nonfat white milk by 1.4% and flavored whole milk by 4.1%. However, sales of low-fat white milk and flavored reduced-fat milk increased by 2.3 and 1.1%, respectively.
The frozen dessert category comprised 385 plants in 2010. These plants manufactured 3452 million l (912 million gallons) of regular ice cream, 1438 million l (380 million gallons) of low-fat ice cream, 188 million l (49.7 million gallons) of frozen yogurt and 187 million l (49.3 million gallons) of sherbet (Schultz, 2011a). The most popular flavor of ice cream continued to be vanilla (29%), followed by chocolate (14%) and strawberry (3.3%). The per capita consumption of regular ice cream in 2008 was 6.3 kg (13.9 pounds); that of low-fat ice cream was 3.1 kg (6.8 pounds). The per capita consumption of ice cream (10% fat or less) has declined in recent years. However, the premium ice-cream (16–18% fat) market has prospered. Also, frozen-yogurt consumption was 1.9 kg (4.3 pounds) per person (Schultz, 2011a).
Dairy farmers and dairy processors alike abide by strict state and federal sanitary standards. Grade A Pasteurized Milk Ordinance (PMO) regulations are basically the recommendations of the Public Health Service of the Food and Drug Administration (FDA) of the United States Department of Health and Human Services (USDHHS, 2009). The PMO is meant for voluntary adoption, but its importance in ensuring the quality and safety of the milk supply in the country is recognized by the dairy industry as well as by state regulatory and sanitation officials. The PMO is a constantly evolving set of regulations designed to accommodate advancements and developments in science and technology related to milk production, processing, packaging and distribution. From time to time, modifications in the regulations are adopted following an agreement among the representatives of government, industry (milk producers, processors, equipment manufacturers and suppliers), academia and research institutions. To conform to the PMO, dairy farms and dairy plants are visited regularly by representatives of government regulatory agencies, who conduct quality-assurance and safety inspections. The inspectors confirm herd health, oversee veterinary practices, monitor sanitation of the facilities and milking equipment, and verify that the milk is being rapidly cooled and properly stored before delivery to processing facilities. They also ensure that the processing of milk is in accordance with the state and federal food laws. In some instances, state standards differ and may be even more stringent than the federal standards. The state, and in some cases local communities, has jurisdiction over standards for milk in its own market. The reader is referred to Chapter 3 for information on the regulatory requirements for milk production, transportation and processing. Chapter 4 details product standards and labeling.
Table 1.3 Production of dairy products in the USA during 2006–2010. Adapted from IDFA (2011) and USDA (2011b).
The PMO defines Grade A specifications and standards for milk and milk products in order to facilitate the movement of milk across state lines. Market milk, cream, yogurt, cultured buttermilk and sour cream are governed by the Grade A standards. Reciprocity rights maintain that milk conforming to the PMO sanitary standards in one state will not require further inspection for acceptance by another state.
The dairy-food industry has consolidated and continued to make large investments in new, state-of-the-art dairy manufacturing facilities. During the past decade, such developments have enabled a drastic reduction in the number of manufacturing facilities, while total output has increased by 4–5% annually. Continued investment will mean still lower processing costs and higher milk output.
1.4 Fermented/cultured dairy products
Fermented dairy foods have constituted a vital part of human diet in many regions of the world since times immemorial. They have been consumed ever since the domestication of animals. Evidence for the use of fermented milks comes from archeological findings associated with the Sumerians and Babylonians of Mesopotamia, the Pharoes of northeast Africa and the Indo-Aryans of the Indian subcontinent (Chandan, 1982, 2002; Vedamuthu, 1991; Ahmed and Wangsai, 2007; Tamime and Robinson, 2007; Chandan and Nauth, 2012,). Ancient Indian scriptures, the Vedas, dating back some 5000 years, mention dadhi (modern dahi) and buttermilk. Also, the ancient Ayurvedic system of medicine cites fermented milk (dadhi) for its health-giving and disease-fighting properties (Aneja et al., 2002).
Historically, products derived from fermentation of the milk of various domesticated animals resulted in conservation of valuable nutrients which would otherwise deteriorate rapidly under the high ambient temperatures prevailing in South Asia and the Middle East. Thus the process permitted consumption of milk constituents over a period significantly longer than was possible for milk itself. Concomitantly, conversion of milk to fermented milks resulted in the generation of a distinctive viscous consistency, smooth texture and unmistakable flavor. Furthermore, fermentation provided food safety, portability and novelty for the consumer. Accordingly, fer...