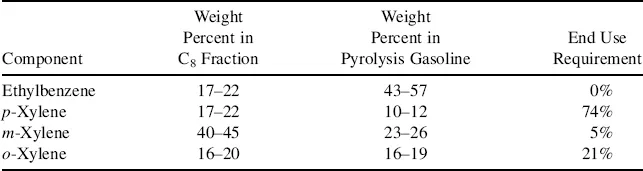
![]()
Chapter 1
The Evolution of the Organic Chemicals Industry
The United States, Western Europe, and Japan are the most complex societies that have ever existed. Division of labor has been carried to the point where most people perform highly specialized tasks and rely on many others to provide them with the goods and services they need. In return for these goods and services, they provide their outputs to satisfy the needs of others. All men are brothers in a material sense just as they should be in a moral sense.
The various segments of the economy are interrelated in a complex way. For example, manufacturing industry draws heavily on the output of the mining sector by buying iron ore from which to make steel. In turn, it may convert that steel to machinery to sell back to the mining industry where it will be used in mining operations.
1.1 The National Economy
The interdependence of a society's activities may be seen more clearly if its economy is divided into specific industries or groups of industries. Until 1997 this was done according to the standard industrial classification (SIC) of the U.S. Bureau of the Census, but this has now been revised as the North American Industry Classification System (NAICS). Table 1.1 shows the main sectors of a developed economy. The manufacturing sector is designated sections 31–33. Each industry within it is allocated a three-digit code number, chemical manufacturing being 325. Sectors, subsectors, and sub-subsectors of the industry are then allocated four-, five-, and six-digit numbers, For example, Basic Chemical Manufacturing is 3251, Dyes and Pigments are 32513, and Synthetic Organic Dyes and Pigments are 325132. Broadly speaking, the basic chemical industry (NAICS 3251) isolates or synthesizes chemicals, whereas the allied products industries (NAICS 3252–3259) modify, formulate, and package products based on those chemicals. The NAICS codes for the chemical industry are shown in Table 1.2.
Table 1.1 Main Sectors of a Developed Economy.
Source: United States Census Bureau, Annual Survey of Manufacturers 2010.
Table 1.2 Breakdown of Manufacturing Category NAICS 31–33 (2009a)
The combined value of shipments is the total sales of the industry. Value added is defined as the value of shipments less cost of raw materials and cost of manufacture (Appendix A). Value added per employee is the productivity. Among the specific items in the cost of manufacture are containers, fuels, purchased electricity, bought-in services, and contract work. It is thus the value added to all the inanimate inputs to an industry by the people working in it. The total value added throughout the economy is the gross national product (GNP), the sum of wealth produced by the nation, in this case about $14.35 trillion for the United States in 2009, amounting to $46,740 per person.
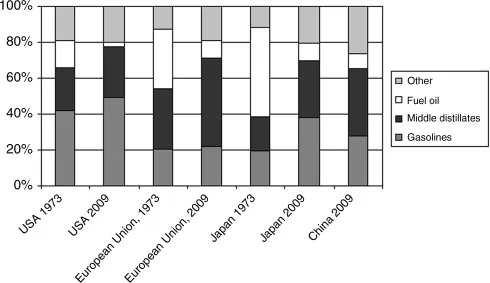
The manufacturing sector contributed about $2.3 trillion of value added, which was about a sixth of that year's GDP (gross disposable product = GNP − net income from abroad). The figure has dropped from about 40% in the past generation. This underscores the point that manufacturing, the traditional means for creating wealth, is no longer the major part of our national economy and has to some extent been replaced by services.1 A similar shift has occurred in Europe and the data are shown in Figure 1.1.
In 1991 the chemical industry provided the largest amount of value added among manufacturing industries and, while surrendering the position briefly, it was firmly in position by 2009 (a bad year). Its main competition has been from Food Manufacturing (311), Transportation Equipment (336) and Computers and Electronic Products (334). In shipments, in 2009, it tied with Food Manufacturing (311) and was followed by Transportation Equipment (336), Petroleum and Coal Products (324), and Computers and Electronic Products. The Chemical Industry ranks only sixth in the number of employees. Value added per employee is the usual measure of productivity, and here the chemical industry ranks third after Beverage and Tobacco Products and Petroleum and Coal Products.
These data are shown in Figure 1.2.
1.2 Size of the Chemical Industry
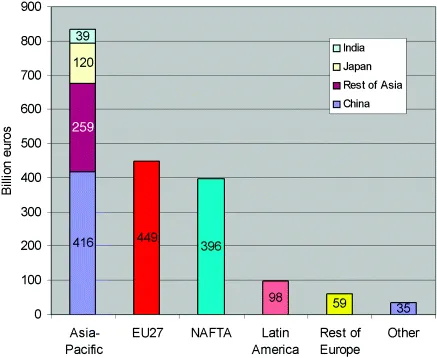
The world chemical industry produced sales of about $3 trillion in 2008 (1871 billion euros in 2009); the euro:dollar exchange rate varied between 1.2 and 1.4 over these years). It provided jobs directly for more than 7 million people and indirectly for 20 million. The division by product sector is shown in Figure 1.3 and by region in Figure 1.4. The United States accounted for about 21% of this business, the European Union (25 countries) for 24%, and Japan for about 6.4%. Asia-Pacific, a relative newcomer, accounted for 38% if Japan is excluded. Other regions are much less significant. Fourteen years ago, the United States accounted for a third and Japan for about 15%, so there has been a huge swing to Asia-Pacific. This will be discussed in Chapter 2. During the previous 10 years, world trade in chemicals grew more than 1.6 times faster than that of global output and has risen to an estimated €970 billion (US$ 1.2 trillion). Almost 45% of the value of the global chemical industry is traded, and more than 35% of this world trade is intracompany in nature.
EU 27 embraces the expanded European community including the 12 Eastern European countries recently admitted. NAFTA is the North America Free Trade Organization – the United States, Canada, and Mexico. “Rest of Europe” includes Switzerland, Norway, and the Central and East European countries not in the EU; “Other” is Oceania and Africa.
Figure 1.3 shows that commodity chemicals (inorganics plus petrochemicals) make up half the global market with specialties (life science and performance chemicals) making up the other half. Performance chemicals include specialty surfactants, electronic chemicals, specialty adhesives and sealants, explosives, catalysts, cosmetic additives, dyes and pigments, flavors and fragrances, specialty lubricants, oil field chemicals, paint additives, photographic chemicals, photovoltaic chemicals, plastics additives, and water treatment chemicals. Life science chemicals include pharmaceuticals, agrochemicals, fine chemicals, animal health products, nutritional products and vitamins, diagnostic substances, and biological products.
The division by sector, although the categories do not match NAICS categories precisely, suggests that the world pattern is close to the U.S. pattern. For example, NAICS 32532 + 32541 (pharmaceuticals and agrochemicals) comes to 27.7% compared with life science chemicals at 28%; inorganics (32512 + 32518 + 32534) comes to 9.1% compared with 9%; and petrochemicals + textiles (32511 + 32519+ 3252) comes to 39% compared with 40%. This is perhaps surprising in that one would expect the United States to have a higher proportion of sales of the higher value specialties.
The U.S. industry had sales of about $300 billion in 1992, $460 billion in 2000, and $751 billion in 2008. The division by shipments is shown in Figure 1.5 and Table 1.3, which also show the division by value added. Petrochemical manufacturing has easily the highest value added per employee, reflecting the small labor force required to operate the huge, semiautomatic cracking units. The same, but to a lesser extent, applies to fertilizer manufacturing, which is based on huge ammonia plants.
Table 1.3 United States Chemical Industry 2008.
Source: U.S. Census Bureau, American Factfinder.
Comparison of the shipments and value added in Figure 1.5 shows that “fine chemicals,” such as pharmaceuticals, pesticides, and toilet preparations, make a larger contribution to the chemical industry's value added than they do to its shipments. They tend to be high-priced products with specialized markets, and their manufacture is less capital- and more labor-intensive than the manufacture of the run-of-the-mill general chemicals. Their importance to the chemical industry is best represented by the value-added figure, which, for example, empha...