In an age where customer opinion and feedback can have an immediate, major effect upon the success of a business or organization, marketers must have the ability to analyze unstructured data in everything from social media and internet reviews to customer surveys and phone logs. Practical Text Analytics is an essential daily reference resource, providing real-world guidance on the effective application of text analytics. The book presents the analysis process so that it is immediately understood by the marketing professionals who must use it, so they can apply proven concepts and methods correctly and with confidence.
By decoding industry terminology and demonstrating practical application of data models once reserved for experts, Practical Text Analytics shows marketers how to frame the right questions, identify key themes and find hidden meaning from unstructured data. Readers will learn to develop powerful new marketing strategies to elevate customer experience, solidify brand value and elevate reputation. Online resources include self-test questions, chapter review Q&A and an Instructor's Manual with text sources and instructions.
eBook - ePub
Practical Text Analytics
Interpreting Text and Unstructured Data for Business Intelligence
- English
- ePUB (mobile friendly)
- Available on iOS & Android
eBook - ePub
Practical Text Analytics
Interpreting Text and Unstructured Data for Business Intelligence
About this book
Trusted by 375,005 students
Access to over 1.5 million titles for a fair monthly price.
Study more efficiently using our study tools.
Information
06
Predictive Models 1
Having words with regressions
Understanding predictive models 146
Starting from the basics with regression 148
Rules of the road for regression 153
Divergent roads: regression aims and regression uses 156
Practical examples 158
Summary 168
References 170
KEY QUESTIONS
What more can we do with text than describe or depict it?
And how does regression do that?
Chapter 6 delves into the subject that held many of us in awe, or terror, in a class in statistics: regression – but this time in connection with analysing text. We aim first to show that it is not that bad after all, conceptually. The great familiarity of regression, compared with other types of advanced analytics, means that this may be the most acceptable form of predictive modelling for some clients. Regression, though, actually has more rules and expectations about data than the other predictive methods we will investigate in detail, classification trees and Bayesian networks. We will discuss a few of the basic requirements for regression so that you follow what is happening in the demonstrations of practical applications. We also highlight and explain the output from two heavyweight statistical programs, Statistica and SPSS.
Understanding predictive models
The methods we reviewed so far, including clustering, factor analysis and putting words into pictures all have an important quality in common. They show patterns and similarities, but do not show the ways in which a variable or variables will influence an outcome. That is, they are descriptive, rather than predictive. We discussed the distinctions between these two types of models in the last chapter. Still, for those of you who skipped directly to this section, or who feel a little unhabituated to the differences, here is a brief review.
Descriptive models show patterns and relationships. They give you valuable information about overall patterns, predominant features and relationships. They do not show what influences results and do not generate models that can be used for forecasting or prediction.
Predictive models, on the other hand, are designed to give you guidance about what influences or explains some result. For instance, you might want to know what motivates people to buy something, to donate to a charity, or to stay on a website. You also might want to know what makes people say they are more satisfied or more likely to recommend your fine product.
One way to think about the difference is shown in Figure 6.1. Descriptive models are like the landscape at the top, an overview that can provide a great deal of useful information. Predictive models are like the map, giving you directions that will get you to a destination. Both types of models obviously are useful. Descriptive methods can be described as more exploratory. Predictive models often follow more descriptive ones, building on them to create a better pathway to an intended outcome.
Figure 6.1 One way to think of descriptive vs predictive models

The Brandywine Valley Scenic Byway on Route 52 looking toward Route 100 at Winterthur between Greenville and Centreville, Delaware, uploaded 2010, Rick Darke for the US Dept of Transportation website. http://commons.wikimedia.org/wiki/File:Chateau_country.webp. Declared Public Domain at above website of Federal Highway Administration. See also http://www.fhwa.dot.gov/byways/photos/60774.
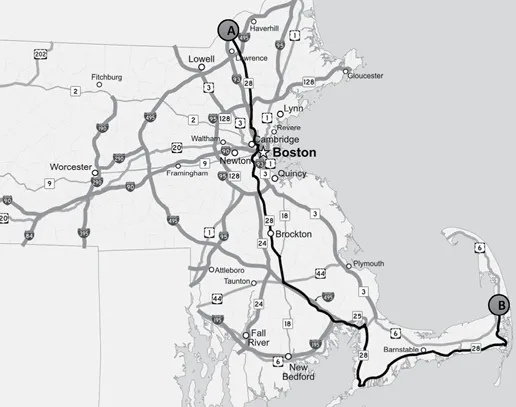
Map of major highways in Massachusetts with Massachusetts Route 28 highlighted, 15 November 2009, own work by uploader ‘Sswonk’ based on public data from Office of Geographic and Environmental Information (MassGIS). http://commons.wikimedia.org/wiki/File:Massachusetts_Route_28.webp.
Starting from the basics with regression
Regression has had a terrific history in predictive modelling. It has developed in many directions over the years. To interpret and use this powerful method, though, we need some basic knowledge. Let’s start at the beginning. (If you are an old hand at regression, you might perhaps want to skip to ‘lines and regression’. Otherwise, here we go.)
To get a regression model, we need at least these elements: one variable that we want to forecast or predict and another variable that we will use to predict it. The variable we want to forecast is called the dependent variable or target variable. The variable we are using to forecast or predict it is called the independent variable or the predictor variable.
Regressions have a target variable that we are trying to forecast or predict using the other variables. The target is called the dependent and the other variables the independents. We really cannot predict anything, but rather can make forecasts. Think of weather forecasts rather than magical answers when dealing with so-called predictive modelling.
You may well wonder why the last paragraph said ‘forecast or predict’. The unfortunate truth is that we cannot actually predict anything. If we could, your author would now be on his private island – writing this book of course, but on that island. Instead, we can forecast. Just think of a weather forecast to get the distinction between a forecast and a prediction. That is, we can say what is likely to happen, and we may even be able to say how likely something is to happen. We cannot say what actually will happen with complete certainty.
Still, the term predictive models has gained a tremendous amount of currency, and although it is not accurate, we will not fight the flow, and so will use it. We just need to recall that these methods do not have magical or even oracular properties, and go from there. A colleague is fond of saying that the goal of analytics is reducing uncertainty. That is less lofty than telling the future, but still an admirable objective.
Now that we have settled that, we can get back to – well – predictive models. We construct one of these either because we cannot directly measure the target variable we want to predict, or because we want to know which variables influence a target variable and just how much influence these variables have.
Predictions and glue
Let’s take a specific example. Suppose we need to heat up a pot of glue until it is warm enough to work its best. We would like to have a reliable to way to know, for future reference, how much natural gas we need to warm the pot to the right temperature. We have a valve on the natural gas burner that ranges from zero to 10. We turn the dial on the gas from zero to one and measure the glue’s temperature with our rusty old thermometer. Then we raise the dial a notch at a time.
IMAGE 6.1 Finding the melting point

Source: Pressure cooker on induction burner, uploaded 2013. http://www.flickr.com/photos/dinnerseries/8556666861.
The result appears in the chart in Figure 6.2. The plot that accompanies it shows the same information in graphical form. We also have included a straight line that represents an average of the relationship between the two variables, the independent (gas valve reading) and the target (temperature).
Figure 6.2 Plotting the values of an independent and target variable
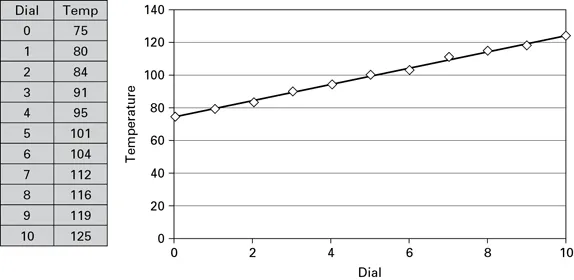
The plot in Figure 6.2 follows the well-established tradition of putting the independent variable along the horizontal or x-axis and the target variable along the vertical or y-axis. Looking at this this plot, we can see that the straight line very nearly captures the relationship between the two variables. We can create a formula or equation that explains how much temperature rises on average with each turn of the dial. It looks like this:
Temperature = (5 x dial reading + 75) or
y = 5x + 75
That simply says that if the dial is zero, temperature is still 75, and if we increase the dial by one unit, on average we increase temperature by 5 units or degrees. In a regression, the term at the end (75) is called the constant. As you can see, it is a starting point for the line, the va...
Table of contents
- Cover
- Title Page
- Dedication
- Contents
- Preface
- 01 Who should read this book? And what do you want to do today?
- 02 Getting ready: capturing, sorting, sifting, stemming and matching
- 03 In pictures: word clouds, wordles and beyond
- 04 Putting text together: clustering documents using words
- 05 In the mood for sentiment (and counting)
- 06 Predictive models 1: having words with regressions
- 07 Predictive models 2: classifications that grow on trees
- 08 Predictive models 3: all in the family with Bayes Nets
- 09 Looking forward and back
- Glossary
- Index
- Copyright
Frequently asked questions
Yes, you can cancel anytime from the Subscription tab in your account settings on the Perlego website. Your subscription will stay active until the end of your current billing period. Learn how to cancel your subscription
No, books cannot be downloaded as external files, such as PDFs, for use outside of Perlego. However, you can download books within the Perlego app for offline reading on mobile or tablet. Learn how to download books offline
Perlego offers two plans: Essential and Complete
- Essential is ideal for learners and professionals who enjoy exploring a wide range of subjects. Access the Essential Library with 800,000+ trusted titles and best-sellers across business, personal growth, and the humanities. Includes unlimited reading time and Standard Read Aloud voice.
- Complete: Perfect for advanced learners and researchers needing full, unrestricted access. Unlock 1.5M+ books across hundreds of subjects, including academic and specialized titles. The Complete Plan also includes advanced features like Premium Read Aloud and Research Assistant.
We are an online textbook subscription service, where you can get access to an entire online library for less than the price of a single book per month. With over 1.5 million books across 990+ topics, we’ve got you covered! Learn about our mission
Look out for the read-aloud symbol on your next book to see if you can listen to it. The read-aloud tool reads text aloud for you, highlighting the text as it is being read. You can pause it, speed it up and slow it down. Learn more about Read Aloud
Yes! You can use the Perlego app on both iOS and Android devices to read anytime, anywhere — even offline. Perfect for commutes or when you’re on the go.
Please note we cannot support devices running on iOS 13 and Android 7 or earlier. Learn more about using the app
Please note we cannot support devices running on iOS 13 and Android 7 or earlier. Learn more about using the app
Yes, you can access Practical Text Analytics by Steven Struhl in PDF and/or ePUB format, as well as other popular books in Commerce & Marketing numérique. We have over 1.5 million books available in our catalogue for you to explore.