
- 352 pages
- English
- ePUB (mobile friendly)
- Available on iOS & Android
eBook - ePub
Food Texture
About this book
Food Texture is the first book to provide a broad overview of texture measurementfrom both the subjective (consumer) and objective (instrument) points of viewand to highlight the relation between objective measures and sensory perceptions.The book's logical presentation opens with coverage of rheology and microstructureanalysis, proceeds to psychophysics, and then moves on to product testing and optimization.Featuring contributions by many of the foremost authorities in the field, Food Textureincludes detailed case histories that offer insight on specific basic and applied researchproblems. It also comprehensively covers the latest methods for subjective evaluationof texture, texture physics and psychophysics, and texture optimization-giving a treatmentof subjective measurement that is available nowhere else in the literature in such aconvenient form.Comprising the most authoritative account of its topic to date, Food Texture will provean invaluable reference for food scientists and technologists, chemists, biochemists,organic and analytical chemists, nutritionists, and microbiologists concerned with sensoryevaluation; graduate students of food science and food engineering; and in-house trainingprograms and professional seminars.
Trusted by 375,005 students
Access to over 1.5 million titles for a fair monthly price.
Study more efficiently using our study tools.
Information
FOOD TEXTURE
I
Physical Measures of Texture
1
The Basics of Solid Foods Rheology
I. INTRODUCTION
The characteristics of perceived “texture” are determined by different physical and physicochemical properties of the food and by the unique and complex features of the human sensory systems. It can be argued, however, that the stimulus in texture perception is predominantly mechanical in nature. Consequently, most, if not all, of the instrumental methods of texture evaluation can also be classified as mechanical tests. To be able to establish the relationship between texture as perceived and the properties of the food, or to interpret the results of instrumental evaluation methods, it is essential to understand the mechanics, or rheology, of food deformation. This, of course, does not entail that rheology is the sole key to understanding texture, and there is ample evidence that geometrical, chemical, thermal, acoustic, and psychological factors can also play a major role in sensory textural assessment. But, even if we only attempt to deal with the rheological aspects of food texture evaluation, enormous difficulties immediately arise. The reason is not so much the mathematical complexity of the pertinent mechanical theories. It is mainly because in comparison with engineering materials for which these theories were originally developed, most foods and biological materials are at the same time highly anisotropic, nonuniform, and, in many cases, chemically active and physically unstable. Anisotropy (as in meat fibers, for example) results in different mechanical properties in different directions, and physicochemical instability produces strong time-dependent properties. The fundamental principles of rheological evaluation of foods, however, are basically the same as those that are applicable to engineering materials, especially polymers. There are, however, differences in the interpretation of the test results. This is because any meaningful interpretation must take into account the specific structural features and the mechanical and biological history of the particular food material in question.
This chapter will only survey the mechanical terminology and describe the main rheological methods of solid foods characterization. It should be stated that the methods to be discussed are only those that are also used in mechanics and material science research, for which the theoretical rheological background is well developed. The discussion will focus, however, not on the quantitative aspects of the tests, but mainly on the physical significance of the results in the context of solid foods and their unique structures. Intentionally, the use of mathematical expressions in this chapter has been avoided as much as possible. The interested reader, however, will be able to find ample material on rheological models and the mathematical aspects of rheological data processing methods in the selected references that are cited in the text and in the general literature of rheology, mechanics, and material science.
II. Stresses, Strains, and Rates
A. Forces and Stresses
1. Normal Forces and Stresses
Normal forces are perpendicular to the surface on which they act and they can be either tensile or compressive (Figure 1a). Normal stress is expressed as units of force per unit area and, again, it can be either compressive or tensile. A normal stress can be presented as engineering stress, which is calculated by dividing the magnitude of the applied force by the initial area of the specimen. It can also be presented as what is called true stress, which is calculated by dividing the force by the actual cross-sectional area of the deformed specimen. Thus, the apparent or engineering stress (σE) is given as (Figure 2):
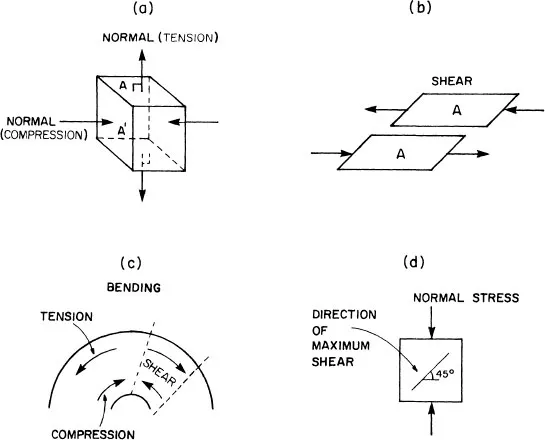
Figure 1 Normal and shear forces and stresses.
(1) |
and the true stress (σT) that varies with time as;
(2) |
where F(t) is the force, and A0 and A(t) are the initial and momentary cross-sectional areas.
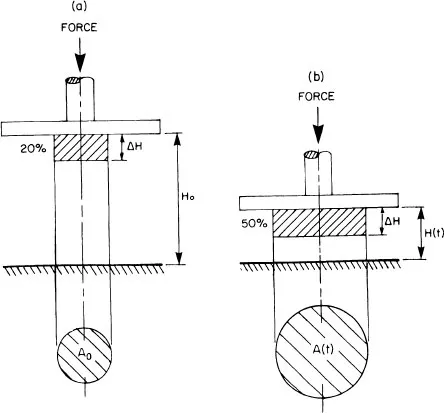
Figure 2 Changes in the specimen dimensions as a result of large deformation. (H0 and A0) are the original length and diameter, respectively; H(t) and A(t) are the dimensions after time t). Note that the same absolute deformation (AH) can be “felt” by the specimen as a different strain.
2. Shear Forces and Stresses
Shear forces are parallel to the surface on which they act (Figure 1b). The shear stress is expressed in the same units as a normal stress (i.e., force per unit area), but the area to be used for its calculation is parallel to its direction.
3. Combined and Local Stresses
In most real bodies, the application of external force will result in different kinds of internal stresses. An illustrative example is bending (Figure 1c), where compressive tensile and shear stresses develop. Even in simpler configurations (e.g., the one shown in Figure 1d), shear stresses develop as a result of applying normal stresses and vice versa (1).
It is also clear that a stress as previously described only refers to an ideal averaged force intensity. For many practical purposes, these ways of stress calculation are satisfactory and provide an effective and convenient tool for analyzing the performance of mechanical systems. It is also recognized, however, that in the loading of a real body, especially with structural irregularities, the actual internal stress distribution can be far from uniform (Figure 3) and, in certain cases, can lead to stress concentration where the intensity by far exceeds the average stress.
B. Deformations and Strains
1. Normal Deformation and Strain
Normal deformation (ΔH) is the absolute elongation or length decrease in the direction of the applied force (Figure 2). The apparent or engineering strain (∈E) is the ratio between the deformation and the initial length of the specimen (H0):
(3) |
Sometimes the engineering strain is given in percent, or percent deformation that is expressed by:
(4) |
For small deformations (i.e., where the length of the specimen can be assumed to be practically unchanged), the engineering strain can also be considered as a true strain. This is not so where the deformation is large, as is clearly evident from Figure 2. For large, absolute deformations, there are several strain definitions (2, 3). It appears that for most food applications, the natural or true strain as defined by Hencky is the most appropriate.
According to this definition, the true strain (ϵT) for compression is given by the logarithmic dimensionless expression:
(5) |

Figure 3 Internal stress distributions as revealed by photoelasticity. Left: A disk compressed between two parallel plates. Middle: The stresses around a hole. Right: The contact region of two flat bodies compressed one against the other. [From M. M. Frocht, Photoelasticity, Vols. 1 and 2, John Wiley & Sons, Inc., New York. (1946). Reproduced with permission, courtesy of John Wiley & Sons, Inc.]
(The reader will notice that while the engineering strain has a range between 0 and 1.0 (or 100%), the true strain has a range between zero and infinity).
2. Shear Deformation and Strain
The absolute shear deformation is demonstrated in Figure 4. For small deformations, the shear strain (dimensionless) (γ) is given by:
(6) |
where ΔX is the deformation, and Y0 is the specimen’s thickness.
C. Loading Rates
Because most solid food materials are viscoelastic in nature (see below), the rate at which they are loaded or deformed may significantly affect their mechanical response. Usually, especially in deformation testing, the magnitude of the rate is selected so as to simulate practical situations. Its regime or mode, however, is usually established by instrumental design considerations. The most commonly referred to rates are the following.
1. Constant Deformation (or Displacement) Rate
Most Universal testing machines that are used in food testing operate at one or more constant speeds. This produces constant deformation rates (i.e., the distance traveled by the crosshead is the same for any given lapse of time irrespective of the specimen’s initial and actual dimensions). If the deformation is small and the changes in the specimen’s length are negligible, the constant deformation rate can be used in the approximation of a constant strain rate () or:
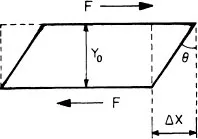
Figure 4 The shear strain geometry (for further explanation, see text).
(7) |
where V is the machine’s crosshead speed (e.g., cm. min–1) and H0 is the initial length of the specimen (e.g., cm).
This is no longer true when the deformation becomes large. In compression, the strain rate actually “felt” by the specimen progressively increases with the advance of the deformation (Figure 5). This is because the same absolute displacement becomes larger relative to the decreasing length of the deformed specimen. In this case, the true strain rate (T) is defined by:
(8) |
and it approaches an infinite value as the specimen length is reduced to zero. The situation is, of course, the opposite in tension wh...
Table of contents
- Cover
- Half Title
- Title Page
- Copyright Page
- Table of Contents
- Preface
- Contributors
- Part I: Physical Measures of Texture
- Part II: The Relation Between Physical and Subjective Measures
- Part III: Subjective Measures of Texture
- Index
Frequently asked questions
Yes, you can cancel anytime from the Subscription tab in your account settings on the Perlego website. Your subscription will stay active until the end of your current billing period. Learn how to cancel your subscription
No, books cannot be downloaded as external files, such as PDFs, for use outside of Perlego. However, you can download books within the Perlego app for offline reading on mobile or tablet. Learn how to download books offline
Perlego offers two plans: Essential and Complete
- Essential is ideal for learners and professionals who enjoy exploring a wide range of subjects. Access the Essential Library with 800,000+ trusted titles and best-sellers across business, personal growth, and the humanities. Includes unlimited reading time and Standard Read Aloud voice.
- Complete: Perfect for advanced learners and researchers needing full, unrestricted access. Unlock 1.5M+ books across hundreds of subjects, including academic and specialized titles. The Complete Plan also includes advanced features like Premium Read Aloud and Research Assistant.
We are an online textbook subscription service, where you can get access to an entire online library for less than the price of a single book per month. With over 1.5 million books across 990+ topics, we’ve got you covered! Learn about our mission
Look out for the read-aloud symbol on your next book to see if you can listen to it. The read-aloud tool reads text aloud for you, highlighting the text as it is being read. You can pause it, speed it up and slow it down. Learn more about Read Aloud
Yes! You can use the Perlego app on both iOS and Android devices to read anytime, anywhere — even offline. Perfect for commutes or when you’re on the go.
Please note we cannot support devices running on iOS 13 and Android 7 or earlier. Learn more about using the app
Please note we cannot support devices running on iOS 13 and Android 7 or earlier. Learn more about using the app
Yes, you can access Food Texture by Howard R. Moskowitz in PDF and/or ePUB format, as well as other popular books in Technology & Engineering & Electrical Engineering & Telecommunications. We have over 1.5 million books available in our catalogue for you to explore.