Measurement and Data Analysis for Engineering and Science, Fourth Edition, provides up-to-date coverage of experimentation methods in science and engineering. This edition adds five new "concept chapters" to introduce major areas of experimentation generally before the topics are treated in detail, to make the text more accessible for undergraduate students. These feature Measurement System Components, Assessing Measurement System Performance, Setting Signal Sampling Conditions, Analyzing Experimental Results, and Reporting Experimental Results. More practical examples, case studies, and a variety of homework problems have been added; and MATLAB and Simulink resources have been updated.
eBook - ePub
Measurement and Data Analysis for Engineering and Science
- 576 pages
- English
- ePUB (mobile friendly)
- Available on iOS & Android
eBook - ePub
Measurement and Data Analysis for Engineering and Science
About this book
Trusted by 375,005 students
Access to over 1.5 million titles for a fair monthly price.
Study more efficiently using our study tools.
Information
1
Introduction to Experimentation
CONTENTS
1.1 A Famous Experiment
1.2 Phases of an Experiment
1.3 Example Experiments
… the ultimate arbiter of truth is experiment, not the comfort one derives from a priori beliefs, nor the beauty or elegance one ascribes to one’s theoretical models. Lawrence M. Krauss. 2012. A Universe from Nothing. New York: Free Press.

Chance favours only the prepared mind. Louis Pasteur, 1879.
1.1 A Famous Experiment
His idea was profound, yet simple - to determine the diameter of the earth by measuring only one angle. His predecessors had postulated certain attributes of the earth and universe. Three hundred years earlier, around 500 B.C., Anaximander suggested that the earth and universe were three-dimensional. Later, Pythagoras proposed that the earth was spherical. Aristotle followed arguing that the earth’s size was small compared to stellar distances [1].
From these suppositions, the Greek Eratosthenes reasoned that the sun’s rays were essentially parallel to the earth. He also learned from travelers from Syene that no shadow could be seen in the Syene well at noon on the summer solstice. This city was about 750 km due south of Alexandria, where Eratosthenes lived. At that moment, the sun must have been directly overhead of the Syene well.
Armed with this information, Eratosthenes conceived of and performed his now-famous experiment [2]. He placed an obelisk vertically on the ground in Alexandria and observed its shadow at noon on the summer solstice. Then, he measured the angle between the obelisk and its shadow. It was 7° 14′ (2 % of the 360° circumference) [3].
Notably, Eratosthenes chose to measure an angle rather than the lengths of the obelisk and its shadow. Angular measurement was sufficiently accurate in his time. In fact, his angular measurement still compares to within 1/60th of a degree of that obtained by modern measurements. However, Eratosthenes also needed to know the distance between Syene and Alexandria to determine the earth’s diameter. Estimating this distance introduced the most uncertainty into his result.
Eratosthenes reasoned that if it took a ([0-9]+)camel 50 days to travel between Alexandria and Syene, covering a distance of approximately 100 stadia per day, then the distance between the two cities was 5000 stadia. Using this distance and his angular measurement, Eratosthenes calculated the earth’s circumference to be 250 000 stadia. This estimate of the earth’s diameter was 7360 km (1 stadium equals 0.071 km), approximately 15 % larger than current measurements (6378 km at the equator).
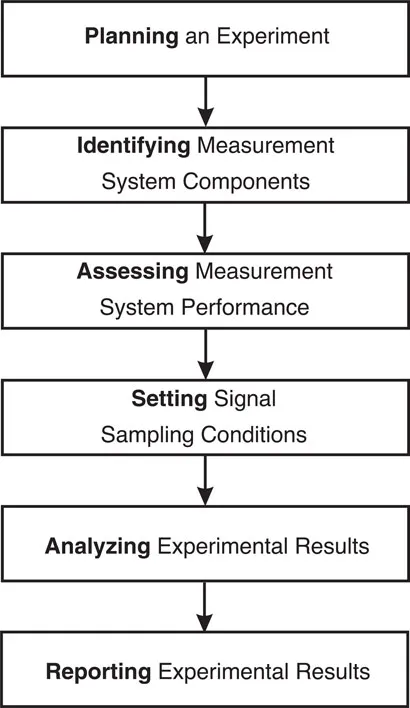
FIGURE 1.1
The phases of an experiment.
The phases of an experiment.
Eratosthenes’ experiment contained many elements of a good experiment. He prepared himself well before beginning his experiment. He used known facts, made plausible assumptions, and employed the most accurate measurement methods of his time. He analyzed the data and concluded by reporting his results.
1.2 Phases of an Experiment
Today, almost two centuries since Eratosthenes’ endeavor, experiments have become much more involved. Computers, sensors, electronics, signal conditioning, signal processing, signal analysis, probability, statistics, uncertainty analysis, and reporting are now parts of almost all experiments. These parts of an experiment can be divided arbitrarily into six phases, as shown in Figure 1.1. In each phase, many practical questions can be answered. Some of these are as follows.
1. Planning an Experiment:
• What defines an experiment?
• How are experiments classified?
• What experimental approach should be taken?
• What steps can assure a successful experiment?
2. Identifying Measurement System Components:
• What are the main elements of a measurement system?
• What basic electronics are used in most measurement systems?
• How can the physical variables be sensed?
• What electronic signal conditioning is required?
• What measurement components are needed?
3. Assessing Measurement System Performance:
• How are input physical stimulus and measurement system output related?
• How are measurement system components calibrated?
• What characterizes the static and dynamic responses of the components?
• What uncertainties are there for a chosen measurement system?
4. Setting Signal Sampling Conditions:
• How are signals classified?
• How does classification affect measurement conditions?
• How much data should be acquired?
• What sampling rate is required ?
• How do sampling conditions affect the results?
5. Analyzing Experimental Results:
• What analytical techniques are used to examine experimental results?
• What statistics are required?
• What statistical confidence is associated with the data?
• How are the data correlated?
• How do they compare with theory and/or other experiments?
• What are the overall uncertainties in the results?
• When is it appropriate to reject data?
• How is an experimental hypothesis accepted or rejected?
6. Reporting Experimental Results:
• What are the proper number, unit, and uncertainty expressions?
• What are the appropriate formats for the written document?
• What elements are needed to communicate the results effectively?
In this text, each phase of experimentation is introduced by its own overview chapter. This overview is followed by the chapters that present that phase’s topics more in depth.
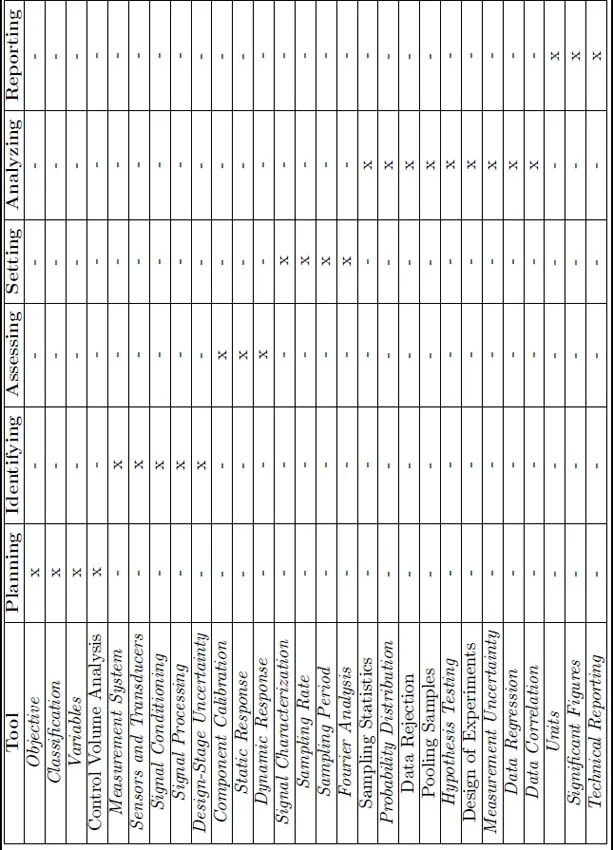
TABLE 1.1
Tools for each experimental phase. Tools that are italicized are applied to the example experiments in their respective overview chapters.
Tools for each experimental phase. Tools that are italicized are applied to the example experiments in their respective overview chapters.
1.3 Example Experiments
The tools developed in this text for each phase of experimentation are listed in Table 1.1. These tools will be illustrated in the overview chapters by applying them to two example experiments, one related to biomedical engineering and the other to environmental engineering.
The tools that are applied specifically to the two example experiments are italicized in Table 1.1. Only the results of using the tools are presented in the overview chapters. It is left to the reader to explore the details of each tool in the chapters related to that phase. Descriptions of the two experiments follow.
Fitness Tracking - A Biomedical Engineering Experiment:
The power expenditure and heart rate of a cyclist during exercise are measured to better understand their relationship with certain environmental factors. A series of high-intensity-interval workout protocols were performed by a recreational cyclist during which power, heart rate, and cadence were measured. The workouts consisted of a strenuous (high-power) effort for a given time followed by an equal-length recovery (low-power) effort. Interval lengths studied included one, three, and 20-minute efforts. The relationship between heart rate and power was studied for different cadences. Data was collected using a commercially available heart rate monitor, a power meter, and a cadence sensor. These sensor outputs were transmitted wirelessly...
Table of contents
- Cover
- Half Title
- Title Page
- Copyright Page
- Table of Contents
- Preface
- Authors
- 1 Introduction to Experimentation
- I Planning an Experiment
- II Identifying Components
- III Assessing Performance
- IV Setting Sampling Conditions
- V Analyzing Data
- VI Reporting Results
- Glossary
- Symbols
- Review Problem Answers
- Index
Frequently asked questions
Yes, you can cancel anytime from the Subscription tab in your account settings on the Perlego website. Your subscription will stay active until the end of your current billing period. Learn how to cancel your subscription
No, books cannot be downloaded as external files, such as PDFs, for use outside of Perlego. However, you can download books within the Perlego app for offline reading on mobile or tablet. Learn how to download books offline
Perlego offers two plans: Essential and Complete
- Essential is ideal for learners and professionals who enjoy exploring a wide range of subjects. Access the Essential Library with 800,000+ trusted titles and best-sellers across business, personal growth, and the humanities. Includes unlimited reading time and Standard Read Aloud voice.
- Complete: Perfect for advanced learners and researchers needing full, unrestricted access. Unlock 1.5M+ books across hundreds of subjects, including academic and specialized titles. The Complete Plan also includes advanced features like Premium Read Aloud and Research Assistant.
We are an online textbook subscription service, where you can get access to an entire online library for less than the price of a single book per month. With over 1.5 million books across 990+ topics, we’ve got you covered! Learn about our mission
Look out for the read-aloud symbol on your next book to see if you can listen to it. The read-aloud tool reads text aloud for you, highlighting the text as it is being read. You can pause it, speed it up and slow it down. Learn more about Read Aloud
Yes! You can use the Perlego app on both iOS and Android devices to read anytime, anywhere — even offline. Perfect for commutes or when you’re on the go.
Please note we cannot support devices running on iOS 13 and Android 7 or earlier. Learn more about using the app
Please note we cannot support devices running on iOS 13 and Android 7 or earlier. Learn more about using the app
Yes, you can access Measurement and Data Analysis for Engineering and Science by Patrick F Dunn,Michael P. Davis in PDF and/or ePUB format, as well as other popular books in Technology & Engineering & Probability & Statistics. We have over 1.5 million books available in our catalogue for you to explore.