![]()
1
Scales of Climatic Study
The very existence of a city has significant modifying effects on the local climate – both within the built-up area, and in the atmosphere above and beyond its boundaries. The nature of these modifications depends on a wide range of physical variables, which can be observed and evaluated at distinctly different spatial scales.
Relative to the Earth's diameter (about 12,700km), the layer of atmosphere blanketing it is extremely thin. The portion of the atmosphere which is directly affected by the terrestrial surface, known as the ‘troposphere’, reaches a height of no more than 10km, and on a short time scale of several days, this affected portion is limited to an even shallower layer known as the planetary or atmospheric ‘boundary-layer’.
In an urbanized area, this lowest part of the atmosphere – known as the urban boundary-layer (UBL) – is decisively affected by the nature of the built-up terrain. The UBL may be further divided into a number of sub-layers, and the distinction between them is fundamental to urban climate.
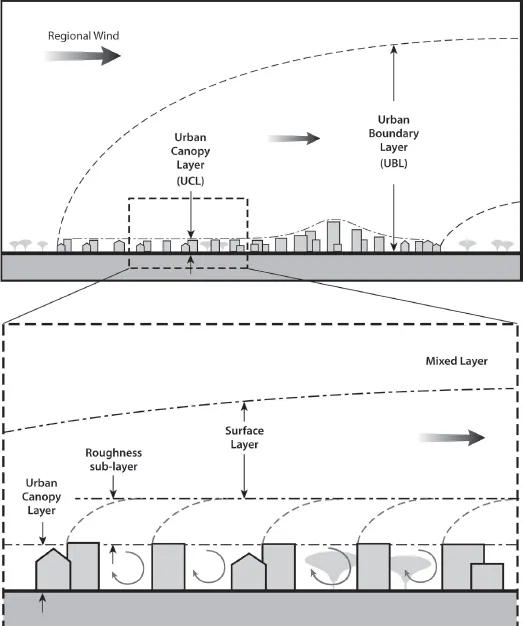
• As depicted in Figure 1.1, the complete UBL is defined as the entire volume of air above the city that is influenced by its surface characteristics and by the activities within it. From the upwind edge of the city, the UBL grows in height as air passes over the built-up terrain (Figure 1.1, top). It generally extends upward to about ten times the height of the buildings in the urban area, and it also extends beyond the urban area in the downwind direction.
• The upper part of the UBL, and the bulk of its volume, is considered a ‘mixed layer’. Within this layer the atmosphere is influenced by the presence of the urban surface, but is not fully adapted to it: in other words, the impact of the non-urban upwind terrain is felt as well. The height of the mixed layer varies according to atmospheric stability and the magnitude of the urban effects.
• Up to a height of about four to five times that of the average building, a surface layer may develop that is entirely conditioned by the 3D geometry and other attributes of the buildings and ground cover below (Figure 1.1, bottom). This surface layer forms when the air has passed over a sufficient length of ground that has urban attributes, including the roughness created by sharp-edged structures and the heat that is generated within the city. Due to the turbulent mixing of air, however, the properties of this layer are not affected by individual urban elements such as single buildings and streets. Rather, they are conditioned by the texture of the urban surface as a whole. This is an extremely important feature, since it is only within this layer that (a) the vertical profile of wind speed follows a systematic logarithmic curve (see Chapter 4) and (b) the vertical exchange of energy between the urban surface and the atmosphere is homogeneous, allowing turbulent fluxes of heat (and pollutants) to be measured at any point above the surface (see Chapter 2). For this reason, the surface layer is also known as a constant flux layer, or alternately as the inertial sub-layer.
• The blending of effects from individual surface features that characterizes the surface layer does not occur immediately above the roofs of buildings, and therefore that layer's lower boundary is typically found at a height of at least twice the average building height. Below this level is a highly variable roughness sub-layer, in which the air-flow consists of interacting wakes and plumes introduced by individual roughness elements. This zone is also known as a layer of transition between the homogeneous surface layer above, and the highly variegated urban surface itself – which is typically comprised of buildings of different heights, vegetation and open spaces of various dimensions.
• The very lowest part of the urban atmosphere is the urban canopy-layer (UCL), which extends from ground level to the height of buildings, trees and other objects. In sharp distinction to the surface layer above, the UCL is characterized by a high level of heterogeneity, since conditions vary widely from point to point within the canopy volume (see Figure 1.1).
Figure 1.1 Schematic section of the urban atmosphere, showing the development of the urban boundary-layer (UBL) relative to the urban canopy-layer (UCL), which reaches the average building height (top), and the distinction between the homogeneous surface layer above the city and the heterogeneous urban canopy (bottom). The mixed layer and roughness sub-layer are transition zones above and below the surface layer, respectively.
Due to the inherent heterogeneity of the UCL, a unique microclimate is established within any given urban space, with air temperature, wind flow, radiation balance and other climatic indicators being determined by the physical nature of the immediate surroundings as well as by the urban and regional environment. The proportions of the space, the thermal and optical qualities of its finish materials and the use of landscape vegetation are all design parameters that modify climate at this scale. Because urban design may have localized impacts such as these on outdoor thermal comfort and building energy loads, the microclimate of urban spaces is rightfully considered an architectural issue.
If the term microclimate is in fact defined as ‘the climate that prevails at the micro-scale level’, it is important to quantify the range of spatial scales that fits this definition. In Table 1.1 the idea of micro-scale climate is placed within a geographical context, showing the characteristic dimensions and atmospheric processes that apply to different levels of scale. Note that there is considerable overlap between the dimensional ranges given for different scales, since the scale at which different phenomena occur will inevitably vary according to the specific terrain.
The macro-scale is appropriate for describing air masses and pressure systems related to weather – phenomena which are viewed on a scale of hundreds of kilometres. While large urban areas may influence such weather patterns, this level of scale does not resolve detailed features of cities. However at the meso-scale, which describes terrain on the order of magnitude of tens of kilometres, urban areas and their internal climatic effects are clearly identifiable. At the local scale, a resolution of single kilometres or less can clearly reflect man-made objects such as buildings, which – in the context of a city or town – make up the urban fabric. This scale, also known as the urban scale, is of primary interest in the study of urban climatology.
Still, architectural decisions are typically made at a smaller scale than this, with buildings or groups of buildings in a single design project rarely covering an area that is more than several hundred metres wide. The micro-scale refers to this smallest realm, where individual structures and trees cast shadows and divert the flow of wind, and where built elements as fine as balconies and textured wall cladding modify the reflection of sunlight and the radiant temperatures to which people are most directly exposed.
Table 1.1 Differentiation of spatial scales for climatic study, with characteristic dimensions and phenomena as suggested by Oke (1987)
| | Scale | Approximate limits | Characteristic climatic phenomena |
| Macro-scale | >100km | Jet stream, hurricanes |
| Meso-scale | 10km–200km | Local winds, thunderstorms, large cumulus clouds |
| Local/urban scale | 100m–50km | Tornados, small cumulus clouds |
| Micro-scale | 1cm–1km | Dust devils, small scale turbulence |
Geometric descriptors of the urban fabric
Despite the heterogeneity of the urban canopy in almost any real city, it is useful to describe the fabric of buildings and open spaces in terms of quantifiable measures that express its density or other physical properties that influence the micro-scale climate.
The urban canyon
One of the most widely used models for making such a description is the urban canyon – which, as its name would suggest, refers to a linear space such as a street which is bounded on both sides by vertical elements such as the walls of adjacent buildings. As a model, the urban canyon may represent both a recurring module from which the textured urban surface is composed, and an individual space that is inhabited at ground level by people and urban activity.
The geometry of the urban canyon may be described by three principal descriptors (see Figure 1.2):
• The height–width (H/W) ratio, also known as the aspect ratio, describes the sectional proportions of the urban canyon. It is defined as the ratio between the average height of adjacent vertical elements (such as building facades) and the average width of the space (i.e. the wall-to-wall distance across the street). While the aspect ratio applies most directly to symmetrical canyons whose adjacent buildings are of continuous height and have a common setback, the averaging of both height and width allows for a general categorization of real-world streets which are almost always irregular to one degree or another. An additional measure, which is sometimes used together with H/W, is the canyon length L, though in many cases L is much larger than either H or W and the stree...