eBook - ePub
Understanding Political Science Statistics using Stata
A Manual with Exercises
- 184 pages
- English
- ePUB (mobile friendly)
- Available on iOS & Android
eBook - ePub
Understanding Political Science Statistics using Stata
A Manual with Exercises
About this book
This manual walks students through the procedures for analysis in Stata and provides exercises that go hand-in-hand with online data sets. The manual complements the textbook Understanding Political Science Statistics: Observations and Expectations in Political Analysis, by Peter Galderisi, making it easy to use alongside the book in a course or as a stand-alone guide to using Stata. Seljan demonstrates how to run commands in Stata for different kinds of research questions and shows the results of the analyses, using lots of annotated screenshots from Stata version 12 (but compatible with all versions, including Stata Small). Students will be guided through standard processes replete with examples and exercises to ready them for future work in political science research. The diverse group of data sets provided include subsamples of both the 2008 and 2012 American National Election Studies, a Eurobarometer survey, single year and longitudinal congressional district files, the 2012 Comparative Congressional Election Study, and a comparative, crossnational country file. Versions with reduced case numbers and variables are also included that are compatible with Stata Small.This manual (and a parallel SPSS manual) are available as stand-alone products or packaged with the textbook Understanding Political Science Statistics.
Trusted by 375,005 students
Access to over 1.5 million titles for a fair monthly price.
Study more efficiently using our study tools.
Information
1 General Overview
CONTENTS
1.1 Introduction to Using Stata for Data Analysis 1
1.2 First Steps 5
1.1 INTRODUCTION TO USING STATA FOR DATA ANALYSIS
Stata is a statistical software package that allows people with limited programming skills to conduct sophisticated data analysis. The following will serve as a brief primer and guide to the use of Stata/IC.
There are several ways for students to acquire the Stata/IC software. These options are listed in order of descending price.
- Purchase a full, perpetual student license (US$179). This is recommended for those individuals who will wish to continue using Stata on an extended basis.
- Purchase an annual (US$98) or six-month student license (US$65).
- Use Stata in an equipped computer lab on your campus (free).
Additionally, reduced pricing may be available through Stata 13 Grad-Plans™. Check the Stata website to find out whether your school participates in this program: http://www.stata.com/order/students/.
Different versions of Stata have varying data capacities and prices. The most common version, Stata/IC, will allow you to analyze moderate-sized data sets, with up to 2,057 variables and unlimited observations. Users requiring a larger data capacity should purchase version Stata/SE. Users with minimal data requirements (under 99 variables, 1,200 observations) may purchase Stata Small. Note that the EURO69.dta file exceeds this capacity.
Stata File Types
There are three different types of Stata files with which you’ll be working. Each type of file has a unique filename extension, the suffix separated from the base filename by a dot. Each of these files will open with, and only with, the Stata program.
*.dta: This denotes a saved Stata data file. This contains the data (spreadsheet), labels, and missing value parameters that are set up. In the following examples, the files that you will use are ANES2008A.dta and congress2008.dta.
*.do: This denotes a “do-file” (i.e., a file that contains instructions for a particular analysis). This file will include any commands needed to access, manipulate, or analyze your data. I recommend that before you exit Stata, you save and label each do-file that you create using a name (before the period) that reflects the analysis you are conducting, adding a number to the end indicating which run or attempt it was. For example, “agevote1” could denote the set of instructions used on a first attempt to analyze voting by age groups. Stata will automatically add the .do suffix (creating the file agevote1.do). You can then save this for future use on your hard drive. The computer doesn’t care what name you use, but I find it easier to follow my work if I choose names that coincide with my analyses.
*.log: This denotes an output file, also known as a “log file.” These files will record both your commands and the resulting output. Any program, including a text editor, can read this file type. You should also be aware of the default output file (.smcl), which can only be read by Stata. All instructions in this manual will recommend the .log file type for output files.
Examples will mainly be derived from the ANES2008A.dta and congress 2008.dta data files. This will allow your instructor to use the other files for class exercises. Several suggested exercises appear at the end of each section or chapter. One set of exercises will carry through a common, progressive theme for ANES2012A.
Executing Procedures
There are two primary methods to operate Stata. You can either type code directly into the Command box or a do-file or use the pull-down graphical user interface (GUI) menus. There are pros and cons for both of these options.
- Executing Procedures through the Command BoxPros:
- You can easily visualize the logical progression of your analysis from file retrieval, to data manipulation, to analysis.
- It is more time efficient.
- You can easily save your codes in do-files for later retrieval and replication of your analysis.
Cons:- There is a greater learning curve for acquiring proper syntax in your commands.
- Some procedures with a multitude of optional customizations, such as formatting graphics, may require a significant level of syntax memorization.
- Executing Procedures with Pull-Down MenusPros:
- Partially eliminates the need to learn a programming language.
- Provides a clear visualization of the array of options available within each procedure.
- You won’t have to worry about making simple syntax errors (e.g., putting a comma in the wrong place).
Cons:- Clicking through the multiple menus of options that are associated with each procedure can be time intensive.
- It is harder to keep track of what you have been doing and to replicate your procedure.
- You still must be familiar with some Stata syntax, such as how to formulate a proper logical expression.
The choice is yours. Those interested in acquiring data analysis skills to be used beyond the classroom are encouraged to execute procedures using the Command box. The following pages will demonstrate how to use this code-driven format, show the results of analyses, and then present a sample of the use of the pull-down menus. All examples will use screenshots taken from analyses run on a Windows 8.1 platform using Stata IC/12.
Application Overview
When you open Stata for the first time, you will notice five discrete components of the application—the Toolbar, the Review box, the Results box, the Variables box, and the Command box.
The Toolbar
The Toolbar provides easy access to some of the most commonly used application features. From the toolbar, you can open and save files. You can also create log files or do-files. You can edit or simply browse an open data file by clicking on either the Data Editor (read and write) or Data Browser (read only) buttons. Finally, the toolbar is an easy way to search Stata’s many help files. After a search, you can quickly navigate to an open file using the “Viewer” button.
The Command Box
The Command box is where you enter code to be executed. Commands should be entered one at a time. Press the return key to enter your command. Pressing the “page up” button on your keyboard (alternatively, holding down the fn key and pushing the up arrow on an OS-X laptop keyboard) will allow you to quickly retrieve previous commands.
The Review Box
The Review box will keep a running list of all commands executed (both those done by code or by use of the pull-down menus). This list of commands can be sorted by order of execution or alphabetically by clicking on the relevant header. You can also search for specific commands using the search box. Correctly executed commands are displayed in black, while commands with errors are displayed in red. A single click on any command will enter that command into the Command box automatically.
The Variables Box
The Variables box lists all variables in an open data set. This list can be sorted by the order that the variable appears in the data, by the variable’s name, or by a “label” given to a variable to describe its contents. You can also search for variables by name or label using the search tool. Clicking on the blank first column of any variable will enter that variable into the Command box automatically. Alternatively, you can select and enter multiple variables at once. To select a block of variables, hold down the shift key while clicking on the first and last variable in the block. To select a set of variables that does not appear sequentially in your data set, hold down the command key (OS-X) or Ctrl key (Windows) while selecting multiple variables. As before, clicking on the first column of the Variables box will insert selected variables into the command line.
The Results Box
The Results box displays output from all commands. All output is searchable by clicking the magnifying glass in the top right corner of the Results box. Correctly executed commands and the resulting output will display in black. Red text denotes an error message and is generally followed by an error code, in blue. The blue text is a hyperlink and will take you to further information about the specific error you have encountered.
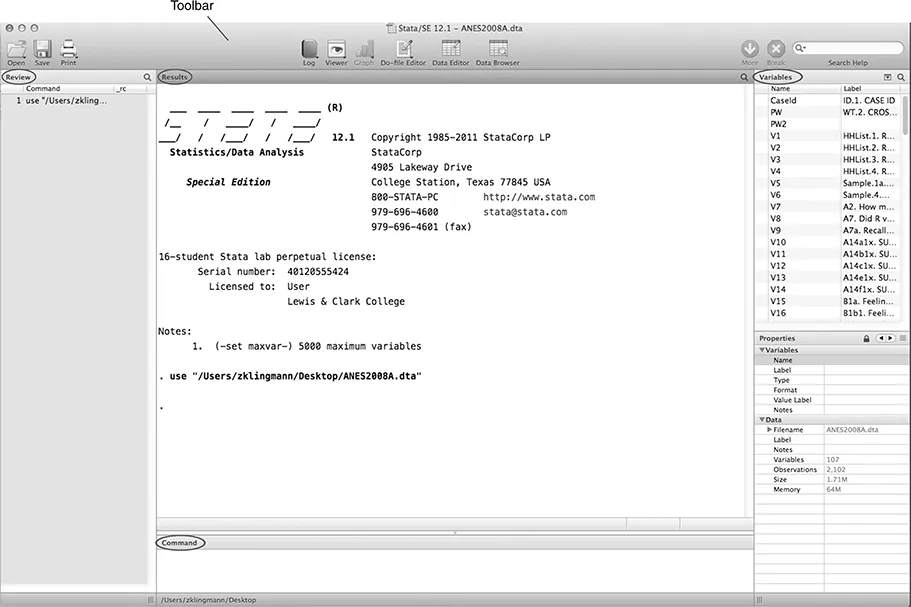
Table of contents
- Cover
- Title Page
- Copyright Page
- Contents
- Acknowledgments
- 1 General Overview
- 2 Setting Up Stata Data Files for Analysis
- 3 Data Management and Operationalization
- 4 Commonly Used Stata Commands for Data Analysis
- Appendix A: Editing Graphs
- Appendix B: Data Codebooks
- Appendix C: An Example of a Term-Wide Set of Computer Exercises–ANES2012A
Frequently asked questions
Yes, you can cancel anytime from the Subscription tab in your account settings on the Perlego website. Your subscription will stay active until the end of your current billing period. Learn how to cancel your subscription
No, books cannot be downloaded as external files, such as PDFs, for use outside of Perlego. However, you can download books within the Perlego app for offline reading on mobile or tablet. Learn how to download books offline
Perlego offers two plans: Essential and Complete
- Essential is ideal for learners and professionals who enjoy exploring a wide range of subjects. Access the Essential Library with 800,000+ trusted titles and best-sellers across business, personal growth, and the humanities. Includes unlimited reading time and Standard Read Aloud voice.
- Complete: Perfect for advanced learners and researchers needing full, unrestricted access. Unlock 1.5M+ books across hundreds of subjects, including academic and specialized titles. The Complete Plan also includes advanced features like Premium Read Aloud and Research Assistant.
We are an online textbook subscription service, where you can get access to an entire online library for less than the price of a single book per month. With over 1.5 million books across 990+ topics, we’ve got you covered! Learn about our mission
Look out for the read-aloud symbol on your next book to see if you can listen to it. The read-aloud tool reads text aloud for you, highlighting the text as it is being read. You can pause it, speed it up and slow it down. Learn more about Read Aloud
Yes! You can use the Perlego app on both iOS and Android devices to read anytime, anywhere — even offline. Perfect for commutes or when you’re on the go.
Please note we cannot support devices running on iOS 13 and Android 7 or earlier. Learn more about using the app
Please note we cannot support devices running on iOS 13 and Android 7 or earlier. Learn more about using the app
Yes, you can access Understanding Political Science Statistics using Stata by Ellen Seljan,Peter Galderisi in PDF and/or ePUB format, as well as other popular books in Social Sciences & Computer Science General. We have over 1.5 million books available in our catalogue for you to explore.