Advances in veterinary medical technology now provide easier and more affordable access to equine ECG recording and transmitting equipment, making ECG recordings a useful tool for equine veterinarians in both field and hospital settings.Covering the basics of equine ECG recording, analyses and interpretation, this book provides a practical approach with details of how to get the most information out of your ECG recordings. The only book dedicated to equine ECGs, it includes: - Numerous clear ECG illustrations- Worked case examples to put theory into practice- New pharmacological therapies and interventional techniquesA hands-on guide for veterinarians to use when recording, diagnosing and treating arrhythmias in horses, this book will be invaluable to both specialists and those who find themselves evaluating the occasional equine patient.
- 128 pages
- English
- ePUB (mobile friendly)
- Available on iOS & Android
eBook - ePub
ECG Interpretation in Equine Practice
About this book
Trusted by 375,005 students
Access to over 1.5 million titles for a fair monthly price.
Study more efficiently using our study tools.
Information
Topic
MedicineSubtopic
Equine Veterinary ScienceBasics of Electrocardiography | 1 |
What is an ECG?
A surface electrocardiogram (ECG) is a graphical representation of the sum of electrical signals produced by the cardiomyocytes during the cardiac cycle. Electrodes attached to the skin are used to detect these signals, which are then transferred by cables to an electrocardiograph, where the signals are filtered, amplified and printed directly on paper or displayed on a screen. Recording an ECG is essential for diagnosing both arrhythmias and conduction disturbances.
Indications for Obtaining an ECG Recording in Horses
In horses, ECGs are required to obtain a definitive diagnosis when an abnormal heart rate or rhythm has been detected on physical examination (Box 1.1).
Box 1.1. Indications for recording an ECG.
• When an arrhythmia is heard on physical examination.
• When horses have unexplained tachyarrhythmias or bradyarrhythmias.
• In the evaluation of horses with exercise intolerance or poor performance.
• In the evaluation of horses with evidence of moderate to severe structural heart disease potentially predisposing to the development of arrhythmias.
• In the evaluation of horses with a history of weakness or collapse.
• To confirm normal sinus rhythm is present during a pre-purchase examination.
• When monitoring heart rhythm as part of therapy (e.g. anti-arrhythmic therapy).
• When monitoring heart rate to detect stress or pain (e.g. during a hospital stay or transport).
• When monitoring a horse during sedation or general anaesthesia.
• When monitoring a horse that is critically ill (e.g. electrolyte imbalance, intoxication).
Electrical Properties of the Equine Myocardium
The generation of an action potential in both nodal and ventricular myocardial tissue is explained in Fig. 1.1. The cell-to-cell propagation of these action potentials results in depolarization (and subsequent repolarization) of larger areas of myocardial tissue, which in turn are detected during a surface ECG recording (Opie, 1998; Bers, 2002).
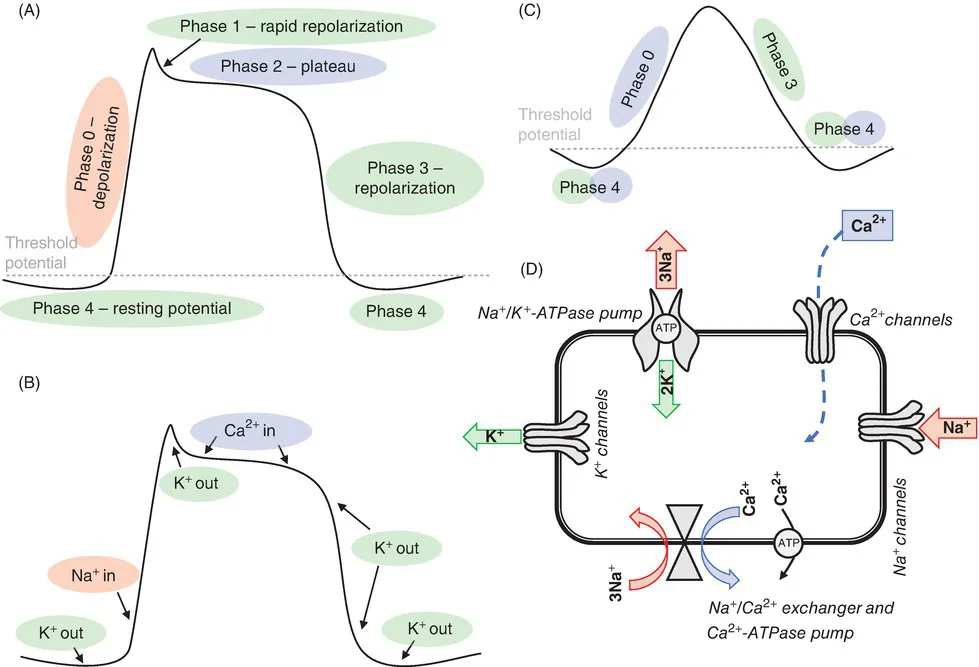
Fig. 1.1. (A) Phases of the action potential (AP) occurring in a typical ventricular cardiomyocyte. There are four phases of the AP, with rapid entry of sodium (Na+) ions into the cell resulting in fast depolarization (phase 0) and calcium (Ca2+) ions entering more slowly during phase 2, resulting in full depolarization of the cell. Potassium (K+) channels open, and outward movement of K+ ions accounts for repolarization of the cell (phases 1 and 3). Phase 4, the maintenance of the resting membrane potential in a state of polarization, results from K+ diffusing out of the cell following the concentration gradient that is maintained by the Na+/K+-ATPase (see panel C). (B) Timing of the movement of ions across the cellular membrane, resulting in the phases of the AP seen in panel (A). (C) Phases of the AP occurring in a typical pacemaker cell (e.g. sinoatrial or atrioventricular node). Here, these cells have a lower resting membrane potential than other cardiomyocytes, with the cell becoming steadily more positive during phase 4 due to slow Ca2+ influx through Ca2+ channels, eventually resulting in spontaneous Ca2+-driven depolarization. Note that the slope of phase 0 is flatter (i.e. slower) than that of the ventricular AP. This spontaneous depolarization of nodal tissue is known as automaticity. (D) A stylized cardiomyocyte, depicting examples of ion pumps, channels and exchangers that allow the movement of ions across the cell membrane, resulting in depolarization and repolarization of the cell membrane. The Na+/K+-ATPase is primarily responsible for maintaining the resting intracellular concentrations of ions (high intracellular K+, low intracellular Na+). Opening of the Na+ channels results in rapid influx of Na+ during early depolarization. Calcium ions enter the cell during the AP through Ca2+ channels, leading to a Ca2+-induced Ca2+ release from the sarcoendoplasmic reticulum (SER) and subsequent contraction of actin and myosin filaments. The excess cytoplasmic Ca2+ is then either eliminated by re-uptake into the SER or removed from the cell via the Na+/Ca2+ exchanger and a Ca2+-ATPase pump. There are several different K+ channels that allow K+ to exit the cell during repolarization and the resting state. (Adapted from Mitchell, 2019, with permission.)
Normal Cardiac Conduction and Components of P-QRS-T Complexes
In horses, the conduction of electrical activity across the heart follows a fairly fixed pathway from the sinoatrial (SA) node, across the atrial myocardium, through the atrioventricular (AV) node and then down the bundle of His, bundle branches and Purkinje system to the ventricular myocardium. The spontaneously depolarizing regular rhythm generated from the SA node is known as ‘normal sinus rhythm’. This normal conduction pattern and resulting surface ECG is illustrated in Fig. 1.2.

Fig. 1.2. (A) The impulse generation and conduction system within the myocardium and (B) a base–apex surface ECG recording resulting from impulse conduction through the different segments of the conduction system. The impulse initiates in the sinoatrial node (SAN) and is transmitted across the atrial myocardium, generating the P wave (B; blue line). Specialized internodal and interatrial (Bachmann’s bundle) pathways facilitate and direct impulse conduction within the atria. At the atrioventricular node (AVN), impulse conduction is delayed, resulting in the PR interval (B; yellow line) observed on the surface ECG. Rapid conduction then occurs through the bundle of His, bundle branches and Purkinje fibre network, activating the ventricular myocardium and generating the QRS complex (B; red line) on the ECG. CrVCa, cranial vena cava; RA, right atrium; LA, left atrium; H, bundle of His; RV, right ventricle; LV, left ventricle. (From Mitchell, 2019, with permission. Adapted from van Loon, G. and Patteson, M. (2010) Electrophysiology and arrhythmogenesis. In: Marr, C.M. (ed.) Cardiology of the Horse. 2nd edn. Elsevier, pp. 59–73; and from Schwarzwald, C.C., Bonagura, J.D. and Muir, W.W. (2009) The cardiovascular system. In: Muir, W.W. (ed.) Equine Anaesthesia, 2nd edn. Elsevier, pp. 37–100, with permission.)
For the depolarization or repolarization to be accurately detected on a surface ECG, a relatively large amount of myocardial tissue is required for activation. Therefore, the sinus depolarizations are not visualized per se; rather, it is the spread of depolarization across the atria creating the P wave that is seen on the ECG. The morphology of the P waves is highly variable between and within horses, with bifid (two positive peaks), single-positive or biphasic (typically negative/positive) waves commonly observed, even within the same ECG trace (Fig. 1.3A). As heart rate fluctuates, the P-wave morphology may change, while some horses display evidence of a wandering pacemaker within the large SA node, particularly at low heart rates (i.e. with high parasympathetic tone), resulting in highly variable P-wave morphology between individual beats. After atrial depolarization, there is a period of atrial repolarization, which can occasionally be seen on a surface ECG as a so-called Ta wave (i.e. the atrial T wave), as seen in Fig. 1.3B.


Fig. 1.3. (A) Typical P-QRS-T complex morphology from a healthy horse, as recorded with a standard base–apex lead configuration, selecting lead I to be displayed. Variable (from bifid to monophasic) P-wave morphology is observed with increasing heart rate. The ventricular depolarization has an S morphology, while the T waves are biphasic (negative–positive). Paper speed: 25 mm/s. (B) A base–apex ECG lead II recording from a horse with second-degree atrioventricular blocks. The atrial repolarization (Ta wave, purple arrow) is observed as a negative depression following the P wave. The P waves have simil...
Table of contents
- Cover
- Half Title
- Title
- Copyright
- Foreword
- Acknowledgements
- Contents
- Chapter 1: Basics of Electrocardiography
- Chapter 2: Recording an ECG
- Chapter 3: Analysing ECGs
- Chapter 4: Interpretation of arrhythmias
- Chapter 5: Therapy
- Chapter 6: Assessment of risk and safety
- Chapter 7: ECG Interpretation in Pre-purchase Examinations
- Chapter 8: Case Examples
- References
- Index
- Back
Frequently asked questions
Yes, you can cancel anytime from the Subscription tab in your account settings on the Perlego website. Your subscription will stay active until the end of your current billing period. Learn how to cancel your subscription
No, books cannot be downloaded as external files, such as PDFs, for use outside of Perlego. However, you can download books within the Perlego app for offline reading on mobile or tablet. Learn how to download books offline
We are an online textbook subscription service, where you can get access to an entire online library for less than the price of a single book per month. With over 1.5 million books across 990+ topics, we’ve got you covered! Learn about our mission
Look out for the read-aloud symbol on your next book to see if you can listen to it. The read-aloud tool reads text aloud for you, highlighting the text as it is being read. You can pause it, speed it up and slow it down. Learn more about Read Aloud
Yes! You can use the Perlego app on both iOS and Android devices to read anytime, anywhere — even offline. Perfect for commutes or when you’re on the go.
Please note we cannot support devices running on iOS 13 and Android 7 or earlier. Learn more about using the app
Please note we cannot support devices running on iOS 13 and Android 7 or earlier. Learn more about using the app
Yes, you can access ECG Interpretation in Equine Practice by Katharyn Mitchell in PDF and/or ePUB format, as well as other popular books in Medicine & Equine Veterinary Science. We have over 1.5 million books available in our catalogue for you to explore.