Characterization of Cereals and Flours is a state-of-the-art reference that details the latest advances to characterize the effects of manufacturing processes and storage conditions on the thermal, mechanical, and structural properties of cereal flours and their products - examining the influence of moisture absorption, storage temperature, baking, and extrusion processing on flour and cereal product texture, shelf-life, and quality. The book discusses the influence of additives on pre- and postprocessed food biopolymers; the development of databases and construction of state diagrams to illustrate the state and function of cereal flours before, during, and after production; and the current techniques in image analysis, light and electron microscopy, and NMR spectroscopy used to analyze the microstructure of cereal products. It also discusses the methods used to optimize processing parameters and formulations to produce end-products with desirable sensory and textural properties; the shelf life of cereal products; and the relationships between the sensory and physical characteristics of cereal foods.
eBook - ePub
Characterization of Cereals and Flours
Properties, Analysis And Applications
- 556 pages
- English
- ePUB (mobile friendly)
- Available on iOS & Android
eBook - ePub
Characterization of Cereals and Flours
Properties, Analysis And Applications
About this book
Trusted by 375,005 students
Access to over 1.5 million titles for a fair monthly price.
Study more efficiently using our study tools.
Information
1
Calorimetry of Pre- and Postextruded Cereal Flours
The Ohio State University, Columbus, Ohio, U.S.A.
Rutgers University, Piscataway, New Jersey, U.S.A.
I. INTRODUCTION
Extrusion processing is widely utilized in the food and feed industries for the manufacture of value-added products. Extrusion processing is a versatile technology producing a wide range of products, including confectionery products, pasta, ready-to-eat (RTE) cereals, flat bread, snack products, texturized proteins, and pet foods. A broad range of operating parameters is used to manufacture products with a large variety of structures and textures, ranging from high moisture (up to 75%)–low temperature (as low as 50°C)–low shear in texturized vegetable and pasta production to low moisture (as low as 11%)–high temperature (as high as 180°C)–high shear in breakfast cereal and snack production.
High-temperature extrusion processing finds wide application in the food industry for the preparation of breakfast cereals and snack foods. Starch-and protein-based cereal flours are frequently encountered as major components of the raw material mixtures. Rice, wheat, oat, corn, and mixed grain cereal flours or meals are commonly utilized for extrusion processing. During extrusion, as a result of shear and high temperatures, usually above 140°C, cereal flours are transformed into viscoelastic melts. Upon extrusion, the melt expands and cools rapidly due to vaporization of moisture, eventually settling into an expanded solid foam. Because extrusion processing is associated with thermal manipulation (mainly heating and some cooling for unexpanded materials) of the materials, thermal characterization of cereal flours and their biopolymer components will lead to data that can be related directly to the processing protocols. Furthermore, thermal characterization of extruded products as a function of storage conditions (relative humidity–temperature) allows evaluation of the impact of such treatment.
In this chapter, we review the characterization by calorimetry of thermally induced conformational changes and phase transitions in pre- and postextruded cereal flours and the use of calorimetric data to elucidate the macromolecular modifications that these materials undergo during extrusion processing. The use of calorimetric data as a tool to evaluate the impact of formulation, processing, and storage on end-product attributes will be demonstrated.
II. CALORIMETRY
Differential scanning calorimetry (DSC) is a thermal analysis technique that detects and monitors thermally induced conformational transitions and phase transitions as a function of temperature. A pair of matching crucibles or sample pans, one containing the sample and one serving as reference, are heated in tandem. As a crucible is heated, its temperature increases, depending on the heat capacity of the contents of the crucible. At temperatures where an endothermic transition occurs, the thermal energy supplied to the crucible is consumed by that transition and the temperature of the sample cell lags behind the reference cell temperature. Conversely, the reference cell temperature lags when an exothermic transition occurs in the sample. A temperature difference between the cells results in heat flow between the cells. DSC measures the differential heat flow between the sample and reference crucibles as a function of temperature at a fixed heating rate. DSC thermograms are normalized to yield the specific heat capacity (Cp) as a function of temperature (1).
At temperatures where crystalline regions of cereal flour components undergo order–disorder transitions, peaks are observed in the heat flow vs. temperature diagrams, either as heat absorption (endotherm) or as heat release (exotherm). Endotherms are typically associated with the melting of mono-, di-, oligo-, and polysaccharides, denaturation of proteins, and gelatinization of starch. Exotherms are observed for crystallization of carbohydrates and aggregation of denatured proteins. When both crystalline and amorphous structures are present, which is typical in cereal flours, an additional transition is observed prior to the exothermic and endothermic transitions. This transition, known as a glass transition, is associated with amorphous materials or amorphous regions of partially crystalline materials. With DSC, the glass transition is observed as a sharp decrease of the heat capacity on cooling and a sudden increase in heat capacity on heating. A typical DSC thermogram, displaying glass, endothermic, and exothermic transitions, is given in Figure 1.
The glass transition temperature indicates a change in the mobility of the molecular structure of materials. Because cooperative motions in the molecular structure are frozen below the glass transition temperature, for partially crystalline materials exothermic and endothermic events are not observed until the glass transition is completed. Slade and Levine (2) discussed in detail that crystallization (exothermic event) can occur only in the rubbery state and the overall rate of crystallization (net rate of nucleation and propagation) in polymer melts is maximized at a temperature midway between the glass transition and melting temperatures. Furthermore, it has been demonstrated that for partially crystalline polymers the ratio of the melting to glass transition temperatures (Tm/Tg) varies from 0.8 to greater than 1.5. This ratio is shown to correlate with the glass-forming tendency and crystallizability of the polymers, because it predicts the relative mobilities of polymers at Tg and at T ≫ Tg. More specifically, polymers with Tm/Tg ≫ 1.5 readily crystallize, while the polymers with Tm ≪ 1.5 have a high glass-forming tendency. Food biopolymers such as gelatin, native starch, and dimers or monomers such as galactose and fructose are reported to exhibit behavior similar to synthetic polymers with Tm/Tg ≪ 1.5, which demonstrates a large free-volume requirement and thus a large temperature increase required for mobility.
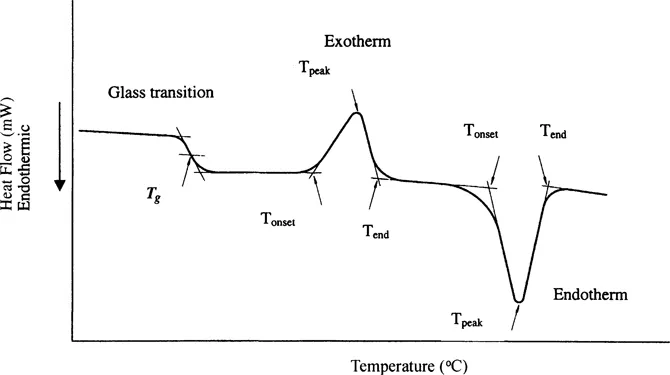
Figure 1 Typical DSC curve for partially crystalline materials.
In DSC thermograms similar to the one in Figure 1, the glass transition is detectable by a step change of the heat capacity. Although Tg can be observed experimentally by measuring physical, mechanical, or electrical properties, it is important to point out that DSC alone supplies thermodynamic information about Tg (3). The thermodynamic property of interest in DSC measurements is the change in the heat capacity, which reflects changes in molecular motions. It should be emphasized that the formation and behavior of the glassy state is a kinetic phenomenon. However, the rubbery state on the high-temperature side of the glass transition is at equilibrium and can be described by equilibrium thermodynamics. Equilibrium thermodynamics also can be applied well below the glass transition temperature because the response of internal degrees of freedom to external effects is very slow. However, during the glass transition, both intrinsic and measurement variables occur on the same time scale, the measured quantities become time dependent, and equilibrium thermodynamics cannot be applied to analyze the system. The system has a memory of its thermal history, which results in the occurrence of relaxation phenomena if the heating and cooling rates are different. It is not possible to get equilibrium values for Tg and the heat capacity change at the glass transition by extrapolating to zero scanning rate because these quantities depend on the thermal history, which includes the scanning rate, annealing temperature, and time.
A complete characterization of the glass transition can be achieved using several parameters. These parameters, as described by Höhne et al. (1), include the temperatures corresponding to vitrification (Tg,f) and devitrification (Tg,i) of the material upon cooling and heating, extrapolated onset temperature (Tg, e), heat capacity change, and the temperature corresponding to the midpoint of the heat capacity change between the extrapolated heat capacity of the glassy and rubbery states (Tg,1/2). The specific heat capacity versus temperature curve derived from a DSC thermogram of a typical glass transition and the parameters describing the glass transition are given in Figure 2.
Tg is also reported as the inflection point of the heat capacity versus temperature curve. The inflection point that corresponds to Tg is the temperature corresponding to the peak in the dCp/dT vs....
Table of contents
- Cover
- Half Title
- Title Page
- Copyright Page
- Dedication
- Preface
- Table of Contents
- Contributors
- PART I. THERMAL ANALYSIS
- PART II. MECHANICAL PROPERTIES
- PART III. STRUCTURAL CHARACTERIZATION
- Index
Frequently asked questions
Yes, you can cancel anytime from the Subscription tab in your account settings on the Perlego website. Your subscription will stay active until the end of your current billing period. Learn how to cancel your subscription
No, books cannot be downloaded as external files, such as PDFs, for use outside of Perlego. However, you can download books within the Perlego app for offline reading on mobile or tablet. Learn how to download books offline
Perlego offers two plans: Essential and Complete
- Essential is ideal for learners and professionals who enjoy exploring a wide range of subjects. Access the Essential Library with 800,000+ trusted titles and best-sellers across business, personal growth, and the humanities. Includes unlimited reading time and Standard Read Aloud voice.
- Complete: Perfect for advanced learners and researchers needing full, unrestricted access. Unlock 1.5M+ books across hundreds of subjects, including academic and specialized titles. The Complete Plan also includes advanced features like Premium Read Aloud and Research Assistant.
We are an online textbook subscription service, where you can get access to an entire online library for less than the price of a single book per month. With over 1.5 million books across 990+ topics, we’ve got you covered! Learn about our mission
Look out for the read-aloud symbol on your next book to see if you can listen to it. The read-aloud tool reads text aloud for you, highlighting the text as it is being read. You can pause it, speed it up and slow it down. Learn more about Read Aloud
Yes! You can use the Perlego app on both iOS and Android devices to read anytime, anywhere — even offline. Perfect for commutes or when you’re on the go.
Please note we cannot support devices running on iOS 13 and Android 7 or earlier. Learn more about using the app
Please note we cannot support devices running on iOS 13 and Android 7 or earlier. Learn more about using the app
Yes, you can access Characterization of Cereals and Flours by Gonul Kaletunc,Kenneth J. Breslauer in PDF and/or ePUB format, as well as other popular books in Technology & Engineering & Food Science. We have over 1.5 million books available in our catalogue for you to explore.