Chapater 1: ‘Boys’ underachievement’: The evidence
Introduction
Before we can begin to set about trying to explain gender differences in educational performance in the early years we first need to ascertain whether such differences actually exist and, if they do, what their precise nature and form is. This is the purpose of the present chapter. The main aim of the chapter is to demonstrate that a high level of continuity exists between the differences in achievements between boys and girls in the early years (i.e. at Key Stage 1) and those found through successive key stages and onto GCSEs (and beyond). As will be seen, all of the key trends and patterns found in relation to gender differences in GCSE results have their origins right back in Key Stage 1. This is an important point to demonstrate in terms of stressing the need for any strategies aimed at addressing the poorer performance of boys in education to begin in the early years.
To do this, the chapter will therefore spend some time looking at gender differences in GCSE examination results in order to identify the major trends and patterns that exist at the end of compulsory schooling. With these trends and patterns in mind, the chapter will then ‘work backwards’ through each key stage to show how they all have their origins in the early years.
‘keeping a sense of proportion’: the gender gap in GCSE performance
One additional benefit of starting the analysis with GCSE results is that it can show, quite effectively, the difference between the rhetoric and the reality of ‘boys’ underachievement’. Much of the data to be analysed below relate to the examination results of 2002. Interestingly, the media response at the time of their publication in August of that year certainly demonstrates the rhetoric that has now become firmly established and continues to be expressed, year-byyear, since the mid-1990s (Arnot et al., 1999). Headlines in the ‘quality’ papers, for example, reported that: ‘Boys Fall Further Behind in GCSE Exams’ (Times Educational Supplement, 22 August 2002) and ‘GCSE Gender Gap Continues to Grow’ (The Guardian, 22 August 2002). The taken-for-granted sense in which this is a growing problem is illustrated in the introductory lines of the report accompanying the headline in The Guardian:
Ministers’ efforts to close the gender gap at GCSE foundered this year as girls once again extended their lead over boys, figures published last night on the eve of results day showed.
Margaret Hodge, education minister, acknowledged the government’s concern admitting that the ‘achievement gap between boys and girls remains unacceptable’. Head teachers blamed a ‘laddish culture’ which was putting government performance targets at risk.
(The Guardian, 22 August 2002)
The rhetoric then is one of boys being disadvantaged compared to girls within education and, moreover, that this disadvantage continues to worsen year on year (Yates, 1997; Esptein et al., 1998a; Raphael Reed, 1999; Martino and Berrill, 2003). As we will now see, the reality is rather different to this.
In examining the actual nature of the evidence, it is useful to use the measure of GCSE performance that encouraged the headlines and reactions above – that is the proportions of boys and girls gaining five or more GCSEs grades A*–C or their equivalent,1 sometimes referred to as the ‘GCSE benchmark’. There are, of course, a number of alternative ways of analysing differences in GCSE achievements.2 However, given the fact that the GCSE benchmark is now widely understood and used (not least in the construction of school league tables in England) and that similar overall patterns of difference tend to emerge whatever alternative measure of GCSE performance is used (Demack et al., 2000),3 this will be the measure that will provide the focus for the analysis to follow.
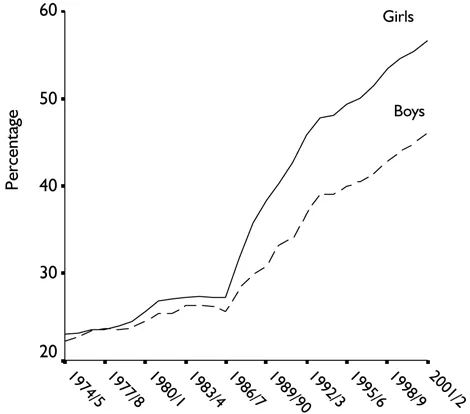
Figure 1.1 illustrates the differential trends in performance of boys and girls from 1974/5 to 2001/2 in England in relation to this GCSE benchmark or its earlier equivalent.4 As can be seen, while boys have always slightly under-performed compared to girls, there does seem to be evidence of a growing gap between boys’ and girls’ levels of achievement since the mid-1980s and, moreover, one that is continuing to increase. It is certainly easy to see why such a conclusion is reached given that the actual size of the gap represented by the vertical distance between the two lines has clearly increased over this period. Indeed it is this percentage point gap that is most commonly quoted by politicians and the media. For 2001/2, for example, there was a 10.6 point gap with 46.0 per cent of boys gaining five or more GCSEs grades A*–C compared to 56.6 per cent of girls. In comparison, in 1991/2 the gap was only 8.6 percentage points with 34.1 per cent of boys and 42.7 per cent of girls gaining the required five passes at this time.
Figure 1.1 Proortion of school leavers in England gaining five or more GCSEs grades A*-C or their equivalent, by gender, 197/-2001/2
Source: Analysis of data supplied by DfES
While such a way of measuring changes in gender differences over time may be simple and easy to understand, it does actually produce a fundamentally misleading picture. Given the central role that this particular measure plays in fuelling the moral panic over boys’ underachievement it is worth outlining briefly what the nature of the problem is with it. In essence, and as Gorard (1999, 2001) has pointed out, at the heart of the problem lies the confusion between percentage point differences and differences in percentage increases in performance between boys and girls. Perhaps the simplest way of illustrating this is to continue with this comparison between the figures for 1991/2 and 2001/2. As can be seen in Table 1.1 the overall proportions of boys and girls achieving the GCSE benchmark are shown for these two years together with the percentage point gaps. By focusing solely on the change in the percentage point gap it would certainly appear that boys have lagged further behind girls over the last ten years. However, a different picture emerges when we look at the percentage increase in performance for boys and girls respectively over this same period. As can be seen, boys have actually increased their performance at a slightly greater rate than girls over this time. Thus there was a 34.9 per cent increase in the number of boys gaining five or more GCSEs grades A*–C over the last ten years compared to a 32.6 per cent increase for girls. Contrary to the generally-accepted picture of boys lagging further behind, therefore, these trends actually provide a little room for optimism.
The main reason for this discrepancy is that it is misleading to simply compare the actual percentage point gaps from year to year without taking into account the overall proportions of boys and girls achieving the GCSE benchmark. As Gorard (2001) argues, there is, quite simply, a need to keep these differences in proportion. For example, if only 5 per cent of boys and 10 per cent of girls passed a particular GCSE examination the percentage point difference (i.e. 10 – 5 = 5 percentage points) would be the same as if 90 per cent of boys and 95 per cent of girls had passed that exam (i.e. 95 – 90 = 5 percentage points). However, we would generally be more concerned about the differences evident in the former case than the latter . To understand why we need to look at it proportionately. Thus, in the first instance girls are twice as likely to pass the examination than boys (i.e. 10 ÷ 5 = 2) whereas, in the second instance, girls are only marginally (1.06 times) more likely to pass the examination than boys (i.e. 95 ÷ 90 = 1.06). In this way, ‘keeping a sense of proportion’ requires us to calculate the relative chances of boys and girls achieving the required examination passes.
Table 1.1 Comparison of the proportion of boys and girls in England gianing or more GCSEs grades A*–C between 1991/2 and 2001/2
Source: Secondary analisis of data supplied by DfES.
Going back to Table 1.1 and the comparison of the proportions of boys and girls gaining five or more GCSE grades A*–C in 1991/ 2 and 2001/2, then we need to similarly divide the proportion of boys who have been successful by the equivalent proportion of girls to provide an indication of the relative chances of boys achieving this GCSE benchmark compared to girls. For 1991/2, dividing the proportion of boys by the proportion of girls gives 0.799 (i.e. 34.1 ÷ 42.7 = 0.799). In other words, boys are only 0.799 times as likely as girls to achieve five or more GCSE grade A*–C passes. To help in the interpretation of this figure we can simply multiply it by 100. This then gives the number of boys per 100 girls achieving the GCSE benchmark (Arnot et al., 1998). As can be seen, for 1991/2 this gives 79.9 boys to every 100 girls. Interestingly, when we do the same calculation for 2001/2 we find that the number has increased slightly so that 81.3 boys are now gaining five or more GCSEs grades A*–C per 100 girls. This small improvement therefore more accurately reflects the slightly greater rate of increase in boys’ achievement over the ten year period compared to girls.
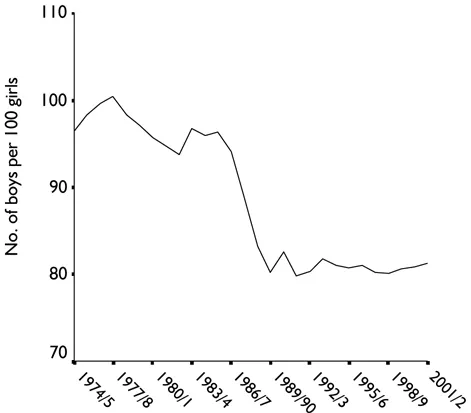
It is this measure of the difference in performance between boys and girls that will be used, where necessary, throughout the remainder of this chapter. Stated as the number of boys per 100 girls achieving the required standard, it is not only easy to comprehend but more crucially it provides a much more valid way of examining changes over time (Gorard, 1999, 2001). With this in mind, we can therefore re-present the data shown in Figure 1.1 using this measure. This has been done in Figure 1.2 that shows the number of boys per 100 girls achieving five or more GCSEs grades A*–C (or their equivalent) between 1974/5 and 2001/2.5 As can be seen, from a period of relative stability from the mid-1970s through to the mid-1980s where about 95 boys to every 100 girls achieved the required benchmark, the relative performance of boys compared to girls did reduce quite significantly from the mid- to the late 1980s. However, from the beginning of the 1990s onwards the relative performance of boys compared to girls has stabilised once again with about 80 boys to every 100 girls achieving the stated GCSE benchmark (Arnot et al., 1998). Indeed, and in line with the data in Table 1.1, there do appear to be some signs of a slight improvement for boys over recent years with their relative performance compared to girls beginning to increase marginally. Rather than boys continuing to lag further behind girls in relation to GCSE performance as the rhetoric so strongly suggests, therefore, the actual reality is that while there is a difference between the achievements of boys and girls it has actually been stable over the last decade and, if anything, boys are now showing some limited signs of beginning to catch up with girls.
Figure 1.2 Number of boys per 100 girl in England gaining five or more GCSEs grades A*–C or their, 1974/5–2001/2
Source: Adatpation of figure in Arnot et al. (1998: 11) with more recent data supplied by DfES.
Gender differences in GCSE subject passes achieved
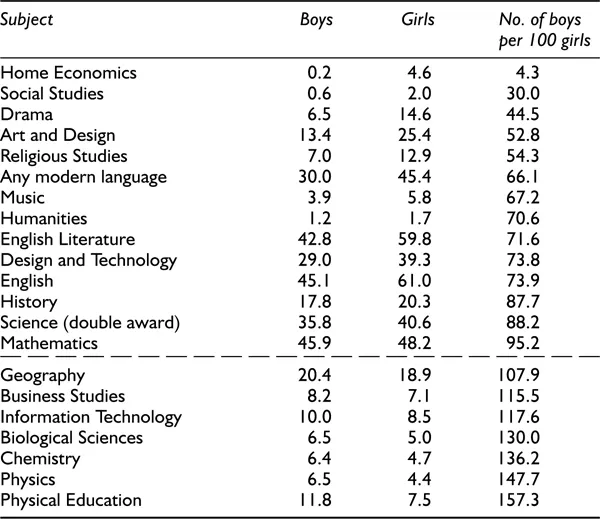
Alongside the misleading picture created in relation to overall trends, there are two other areas in which the rhetoric concerning boys’ underachievement has tended to distort the reality. The first relates to the way in which these overall aggregate results tend to overlook differences in achievements between boys and girls in relation to specific subjects. Table 1.2 provides details of the overall proportions of young people leaving school in 2002 with GCSE grades A*–C passes in particular subjects in England. Undoubtedly, some of the differences evident in the table will be due to the different proportions of boys and girls who have chosen particular subjects and have consequently been entered for a specific examination. However, the key point to draw out from the data in the table is that these are outcome figures – they simply provide an indication of the relative odds of boys and girls leaving school with a higher grade pass in a particular GCSE subject regardless of the reasons why.
Table 1.2 Proportion of school leavers in England gaining a GCES grades A*–;C by subject in 2001/2, by gender (%)a
Source: Secondary analysis of data from DfES (2002b).
Note: a Stated a percentage of the total population of school leaving age.
If we look at the final column of Table 1.2 showing the number of boys per 100 girls achieving a grade A*–;C pass in each subject then it is clear that significant variations exist. In relation to the core subjects, it can be seen that boys are significantly less likely to gain a higher grade GCSE pass in English or modern languages than girls. They also lag behind to a lesser extent in double award science and, while they are also behind in relation to mathematics, the difference is marginal. However, it is also important to note that the rhetoric of ‘failing boys’ tends to ignore the fact that there are subjects where boys are still more likely to leave school with higher grade GCSE passes than girls. This is certainly noticeable in relation to named science subjects as well as subjects such as business studies and information technology. These early differential patterns of specialisation are particularly significant given the fact that these latter subjects can give boys greater access to a number of highlyrewarded occupations (Arnot et al., 1999; Francis, 2000).
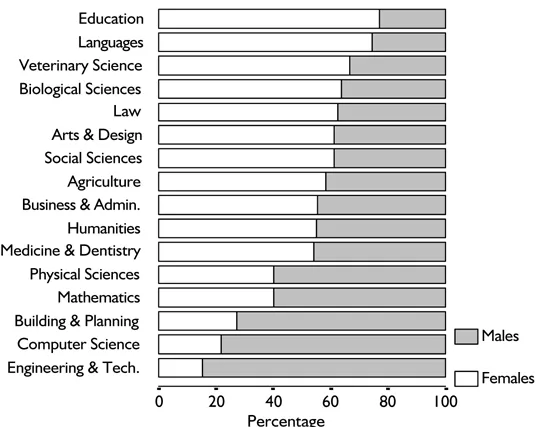
Overall, the key point to emerge from these differences in attainment between subjects is that they represent the start of a process of increasing differentiation that continues through further and higher education whereby young men and women still tend to follow well-defined career pathways. This is illustrated by Figure 1.3 that shows the gender breakdown of those achieving first degrees in particular subjects within the UK in 2002. As can be seen, clear differences still remain in relation to particular subjects that continue to be male- or female-dominated. Moreover, in relation to languages, computer science and engineering and technology degrees, they reflect differences that, as we have seen, are already emerging at GCSE level. This is certainly a point that is overlooked by the rhetoric of boys’ underachievement that simply casts boys universally as the victims. The reality, however, is a little more complex than this with boys continuing to outperform girls in a small number of subjects and, moreover, with both boys and girls finding themselves in a situation where their educational and career opportunities are still significantly constrained in terms of their gender.
Figure 1.3 First degrees awarded in the UK in 2002 by gender
Source: Secondary analysis of data from HESA (2003).
The effects of social class and ethnicity on gender differences in GCSE performance
The final area in which the rhetoric of boys’ underachievement tends to significantly distort the reality that will be highlighted here derives from the tendency simply to compare the performance of all boys with that of all girls as if they represent two distinct and homogeneous categories (Mac an Ghaill, 1996b; Epstein et al., 1998b; Jackson, 1998). The problem with this, as Lucey and Walkerdine (2000) make clear, is that:
all too often simplistic, statistical interpretations which concentrate entirely on gender differences serve to shore up a universal notion of boys’ underachievement and present a picture which powerfully obscures and confuses enduring inequalities in attainment.
(Lucey and Walkerdine, 2000: 38)
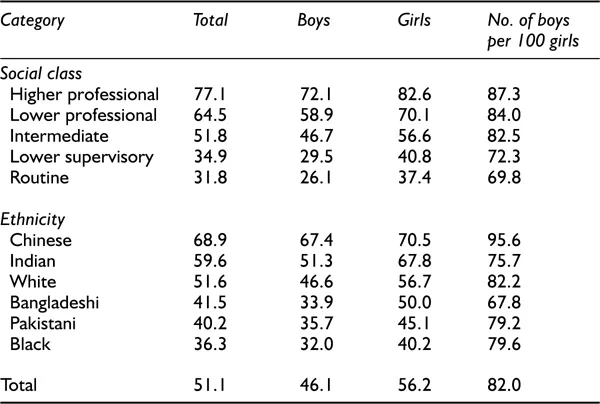
Thus it is not that all boys are uniformly underachieving and that all girls are performing well in education. Rather, such levels of achievement are strongly determined by the social class and ethnic backgrounds of boys and girls (Epstein et al., 1998b). This is a point clearly illustrated by the data in Table 1.3 that shows the effects of social class and ethnicity on the proportions of boys and girls in England and Wales gaining five or more GCSEs grades A*–C in 2000/1. As can be seen, not all boys are ‘underachieving’ with 72.1 per cent of boys from higher professional backgrounds, for example, achieving the GCSE benchmark and 67.4 per cent of Chinese boys. Both these proportions are well above the national average for all school leavers of just 51.1 per cent. Similarly, not all girls are ‘succeeding’. Only 37.4 per cent of girls from routine occupational backgrounds achieved the GCSE benchmark and, similarly, girls from lower supervisory occupational backgrounds as well as Black and Pakistani girls were all significantly underachieving compared with the national average.
Table 1.3 Proportion of boys and girls in England and Wales gaining five more GCES grades A*–C in 2000/1 by social class and ethnicity (%)
Source: Based upon secondary ana...