![]()
| AIMS This chapter outlines how the coastal zone can be defined and discusses the properties and characteristics of systems, highlighting the importance of sedimentary processes and concepts such as self-organisation. Consideration of systems is useful because it provides a framework by which the dynamic behaviour of geomorphological processes and landforms can be understood. |
1.1 Introduction
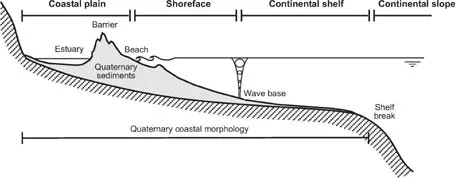
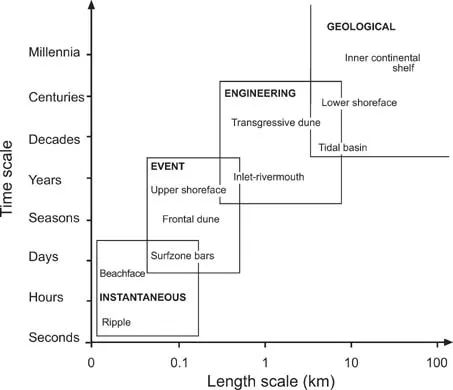
This book is about coastal processes and geomorphology. The spatial boundaries of the coastal zone as considered in this book are defined in Figure 1.1 and follow the definitions set out by Inman and Brush (1973). The upper and lower boundaries correspond to the elevational range over which coastal processes have operated during the Quaternary period, and include the coastal plain, the shoreface and the continental shelf. During the Quaternary (from 2.6 million years ago until present), sea level fluctuated over up to 135 m vertically due to expansion and contraction of ice sheets and warming and cooling of the oceans. The landward limit of the coastal system therefore includes the coastal depositional and marine erosion surfaces formed when sea level was high (at or just above its present-day position) during global warm periods. The lowest sea levels, during global cold periods, placed coastal processes close to the edge of the continental shelf. The seaward limit of the coastal system is therefore defined by the continental shelf break, which typically occurs in water depths of 100–200 m. Changes in global climate during the Quaternary markedly shifted the position of the coastal zone, changing coastal geography particularly in areas with extensive shelves (Case Study 1.1). Many of today’s coastal landscapes reflect their Quaternary (and older) geological inheritance, and are responding dynamically to human activity in the coastal zone and ongoing global warming. Having defined the spatial boundaries of the topic of this book, we now need to indicate the time scale we are interested in. Cowell and Thom (1994) group the time scales over which coastal processes operate into four overlapping classes (Figure 1.3):
• Instantaneous time scales – These involve the evolution of morphology during a single cycle, for example, the formation and destruction of wave ripples by large waves, and onshore migration of an intertidal bar over a single tidal cycle.
• Event time scales – These are concerned with coastal evolution by processes on time spans from individual wave/tide events to seasons. Examples include the erosion of coastal barriers by a major storm or seasonal closure of an estuary by a sand bar.
• Engineering time scales – These are time scales of years to centuries and include the migration of tidal inlets and buildup of sediment in beaches or foredunes. Coastal engineers and managers are most concerned with processes that operate on these time scales.
• Geological time scales – These time scales operate over decades to millennia and correspond to directional trends in the driving forces of sea level, climate and tectonics. Examples include the infilling of a tidal basin or estuary, onshore migration of a barrier system, and switching of delta lobes.
This book will deal with coastal processes and geomorphology on all four time scales.
Figure 1.1 Spatial boundaries of the coastal zone considered in this book.
Case Study 1.1 How long are the world’s coastlines?
In 1967 the mathematician Benoit Mandelbrot (1924–2010) posed the question: How long is the coastline of Britain? There are several reasons why we need to know the answer to this question. First, coastline length has implications for calculation of length (and therefore cost) of coastal protection such as sea walls, and the length (and area) of protected areas. Second, coastline length has implications for calculation of coastal resources such as length of rocky or sandy coasts, productivity of the intertidal zone, or volume of offshore aggregate. Calculating coastline length, however, is not straightforward, because all coasts exhibit complex outlines over different scales. For example, the position of the water-land boundary varies due to tidal state, and by coastal erosion and deposition. Highly indented rocky coastlines are also longer than smooth, sandy coastlines.
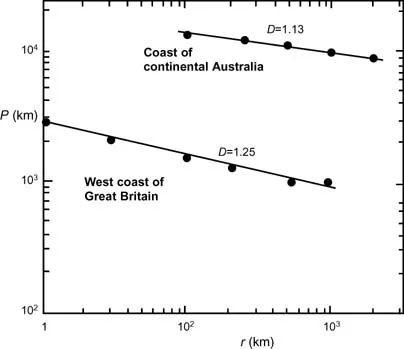
Figure 1.2 Calculations of coastline length P and fractal dimension D for the west coast of Great Britain and continental Australia, based on ‘measuring rods’ r of different length. (Data from Mandelbrot, 1967.)
An important property of almost all coastline types and coastal locations is that they exhibit scale invariance (Mandelbrot, 1967). This means that there is the same degree of complexity in the coast’s outline shape irrespective of the scale at which it is observed. Figure 1.2 shows the length of a mapped coastline P using rods r of different lengths: the shorter the rod the longer the measured coastline. What this means in practice is that very accurate measuring devices give higher coastline lengths. The results plot in a straight line on a log-log scale, which means that the coastline is scale invariant over that scale range. The slope of the line gives the fractal dimension D. The coastlines of Great Britain and Australia exhibit a similar fractal dimension, but Australia is larger than Britain so both P and r are larger.
Figure 1.3 Definition of spatial and temporal scales involved in coastal evolution. (From Cowell and Thom, 1994.) (Copyright © 1994 Cambridge University Press, reproduced with permission.)
1.2 Coastal classification
A variety of coastal landforms and coastline types exists in nature and coastal geomorphologists are concerned with describing and classifying them. Coastal classification schemes can be useful from a conceptual point of view and help to assess the different forcing factors and controls (e.g. sea-level history, geology, climate, waves, tides) that give rise to coastal landforms. Most early classification schemes are based on the role of sea-level variations, and so distinguish between submerged and emerged coasts (Johnson, 1919). Submerged coasts include drowned river and glacial valleys, termed rias/fjards and fjords, respectively. Coastal plains are characteristic of emerged coasts where sea level has fallen. Shepard (1963) identified primary and secondary coasts. Primary coasts result mainly from non-marine processes and include drowned river valleys, rocky and deltaic coasts. Secondary coasts result mainly from marine processes or organisms and include barrier coasts, coral reefs and mangroves. Coasts can also be classified with respect to their tectonic position (Inman and Nordstrom, 1971). Leading edge coasts, also termed collision coasts, are located adjacent to subducting plate margins such as along the Pacific coasts of South America, Japan and New Zealand. Here, tectonic processes have formed mountain belts that have steep, erosive and rocky coastlines, boulder beaches, and falling relative sea levels. Trailing edge coasts, however, are located away from subducting plate margins, are tectonically benign, older and of lower elevation. Examples are coasts of Africa, Australia and Atlantic coasts of North and South America. These coasts are typically sediment-rich, progradational, with large deltas and sandy beaches.
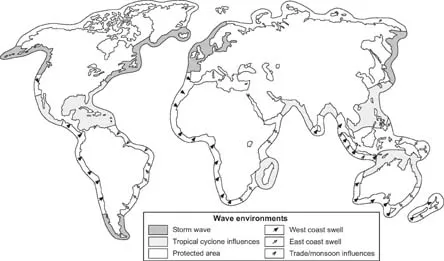
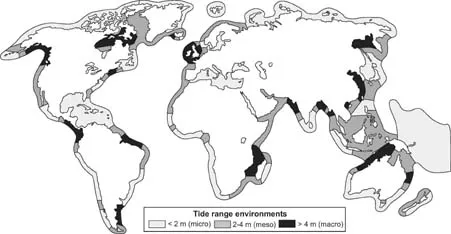
The main shortcoming of these classifications is that they emphasise geological inheritance rather than hydrodynamic processes that shape coastal land-forms. Davies (1980) identified coastal types based solely on wave height and tidal range. Because waves are generated by wind, the distribution of wave environments varies by latitude, reflecting global climate zones (Figure 1.4). Coastlines dominated by storm waves are located in higher temperate and arctic latitudes, whereas swell-dominated coasts are located in lower temperate and tropical latitudes where cyclones (hurricanes) are also important. The tidal range in the middle of oceans is quite small (less than 1 m), but increases towards the coast and may reach in excess of 10 m. The amplification of tides depends on the gradient and width of the continental shelf, the location and shape of continents, and the presence of large embayments. The global distribution of tidal range is therefore controlled by large-scale coastal configuration (Figure 1.5). Macrotidal ranges exceeding 4 m are mostly observed in semi-enclosed seas and funnel-shaped entrances of estuaries. Microtidal ranges below 2 m occur along open ocean coasts and almost fully enclosed seas. Small but noticeable tidal fluctuations also occur in large lakes.
Figure 1.4 World distribution of wave environments. (Modified from Davies, 1980.)
Figure 1.5 World distribution of mean spring tidal range. (Modified from Davies, 1980.)
The glob...