![]()
PartI
THE SCOPE OF
SURVEY
RESEARCH
![]()
The nature of surveys
The purpose of this chapter is to outline briefly what is meant by the term survey research. Any examination of texts on social research or the popular media shows that the term survey is used in many different ways. To avoid confusion we must be clear at the beginning about how the term will be used in this book. The way we define what a survey is affects the range of topics for which we can use a survey, the way in which we conduct a survey and our evaluation of the merits and shortcomings of the survey method.
The primary aim of this book is to provide guidance on how to do good surveys. Some critics of the survey method have responded to problems evident in many surveys by urging that we move away from survey research altogether and employ entirely different research methodologies. However, the solution to criticisms of surveys need not be to abandon survey research but to solve the problems that the critics assume are inherent to the survey approach.
Many criticisms of surveys are based on misunderstandings of what surveys can be and are based on examples of poor surveys and the inappropriate use of survey research. This is not the place to review these criticisms or to argue how they are frequently misinformed. The best discussion of these criticisms is available in Catherine Marsh's book titled The Survey Method: The Contribution of Surveys to Sociological Explanation (1982). The focus of the present book is to show what can be achieved with a good survey and how to achieve this.
WHAT IS A SURVEY?
A survey is not just a particular technique for collecting information: questionnaires are widely used but other techniques, such as structured and in-depth interviews, observation, content analysis and so forth, can also be used in survey research. The distinguishing features of surveys are the form of the data and the method of analysis.
Form of data
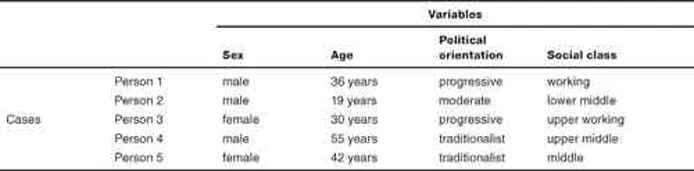
Surveys are characterised by a structured or systematic set of data which I will call a variable by case data grid. All this means is that we collect information about the same variables or characteristics from at least two (normally far more) cases and end up with a data grid. In Table 1.1 each row represents a case (person) and each column represents a variable or information collected about each case. Since the same information is collected for each case the cases are directly comparable and we end up with a structured or ‘rectangular’ set of data.
Table 1.1 A variable by case data grid
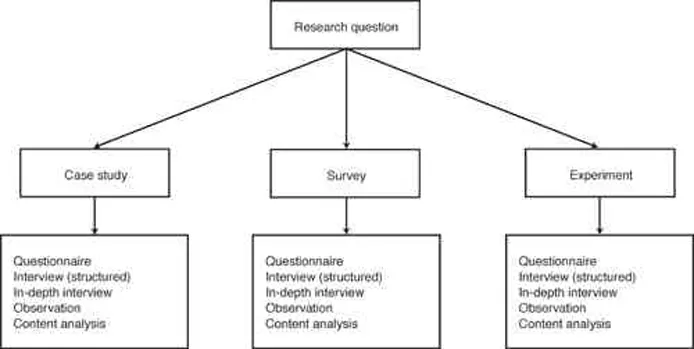
The technique by which we generate data about the cases can vary between surveys. We might collect information by giving a questionnaire to each person and then copying answers from each questionnaire into the data grid. Because questionnaires are highly structured they provide a straightforward way of obtaining information for the data grid. However, the data for the grid could be collected by other means such as interviewing or observing each case, by extracting information from records we have on each person or by many other means. There is no necessary connection between questionnaires and survey research (see Figure 1.1).
The absence of a necessary connection between the survey method and a particular data collection technique is reinforced by the fact that the cases in the variable by case data grid need not be people. Technically the case in the data grid is called a unit of analysis—it is the ‘object’ about which we are collecting information (see Web Pointer 1.1). While this frequently is a person it need not be. We could construct a data grid in which the unit of analysis was a country, a year or virtually anything so long as we collect attributes of that case (see section on units of analysis in Chapter 3). If countries were the cases, a list of countries would be listed down the side of the table instead of people, and attributes of countries (e.g. population size, area, density, unemployment rate) would be listed across the top. If years were the cases, years (e.g. 1980, 1990, 2000, 2010) would be listed down the side with attributes relevant to years across the top (e.g. inflation rate in particular years, divorce rate).
Figure 1.1 A range of methods of research and techniques of data collection
| WEB POINTER 1.1 Units of analysis |
| Clear and brief description of the idea of units of analysis. | www.socialresearchmethods.net/kb/unitanal.php |
The variable by case data grid is fundamental for survey analysis which is based on a comparison of cases. It is this method of analysing data which is the second distinguishing feature of surveys.
Methods of analysis
One function of survey analysis is to describe the characteristics of a set of cases. Thus if we want to describe how a group of people will vote, we need to know how each person in that group intends to vote. A variable by case data grid provides this information.
But survey researchers are also interested in causes of phenomena. The survey analyst tries to locate causes by comparing cases. By looking at how cases vary on some characteristics (e.g. some cases will be political progressives and others will be traditionalists), the survey analyst will see if the progressives are systematically different from the traditionalists in some additional way. For example, in Table 1.1 there is variation between cases in how they vote. This is systematically linked to variations in class: the progressives are working class and the traditionalists are middle class. Survey research seeks an understanding of what may cause some phenomenon (e.g. vote) by looking at variation in that variable across cases, and looking for other characteristics which are systematically linked with it. As such it aims to draw causal inferences (e.g. class affects vote) by a careful comparison of the various characteristics of cases. It does not end there. The next step is to ask why class affects vote. Survey researchers need to be very careful, however, to avoid mistaken attribution of causal links (simply to demonstrate that two things go together does not prove a causal link).
This style of research and analysis can be contrasted with other methods. For example, the case study method focuses on particular cases and tries to develop a full and rounded understanding of the cases. The case study method does not fundamentally rely on comparing cases but on fully understanding the ‘wholeness’ of a particular case and understanding particular attributes of a person (or an organisation or whatever the case is) within the context of the case's other characteristics and history. The experimental method is similar to the survey method in that data are collected in the form of variable by case data grid, but is fundamentally different in that the variation between the attributes of people is created by intervention from an experimenter wanting to see if the intervention creates a difference. For example, the experimenter who wants to know whether a drug cures a disease would take a group of sufferers and divide them into two similar groups. The drug would be administered to only one group and then the recovery rates of the drug and non-drug groups would be compared. Here the variation between the two groups (i.e. drug/non-drug) has been created by the experimenter. A survey approach would not create the variation but would find ‘naturally occurring’ variation; that is, find a group ...