![]()
1
AN EPIDEMIOLOGICAL RIDDLE
An “unusual event” has occurred in which a great loss of life has taken place. The population involved in the event was large and very diverse: men and women, adults and children, different social classes—the rich, the middle class, and the poor. Can we use the available data—a few details about who lived and who died—along with some tools of epidemiology (the science of public health) to figure out what that “unusual event” was? Here are the things we know:
• Over two-thirds of the more than two thousand people involved died.
• Among the adult population, women were three times as likely to survive as men.
• The children under twelve years of age were almost 50 percent more likely to survive than the adults.
• Those in the highest social class were 50 percent more likely to survive than the middle class, and over twice as likely to survive as the lower class.
What was the event? A lethal new virus? An act of terrorism or war? A natural disaster? An accident? How can this sparse “mortality data” on the differences between those who survived and those who perished point the way to the solution?
Epidemiologists use tables to organize data systematically in a way that reflects details about all the individuals exposed to an event (or disease), sorted out by who died and who survived. The two outcomes, life and death, can be categorized and cross-referenced by gender, age, and economic status to give a portrait of how each one affects an individual’s odds of death or survival, and how these three variables interact with each other.
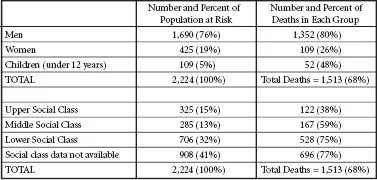
Figure 1.1 gives us the basic mortality data from this event expressed as rates. Of the 2,224 people involved in our unusual event, 1,513, or 68 percent, died, and 711, or 32 percent (fewer than one in three), survived. The actual number of deaths can be deceptive—it’s the rates that matter: the proportion who survived and its inverse, the proportion who died.
What do we know from this first piece of evidence that can help us solve the puzzle? First off, 68 percent—what epidemiologists call the overall or crude mortality rate—is a very high proportion of deaths for any disease or disaster. For an idea of what this death rate signifies, recall that over 2,800 people died in the World Trade Center attack of 9/11, but about 10,000 were in the buildings when the planes struck. The mortality rate of any event that takes many lives is the number of deaths divided by the number of people exposed—the total number at risk for death. So we can say the entire population in the WTC buildings was at risk at the time the planes struck, and that the 28 percent mortality rate in the WTC attack is the proportion that died among all those who were exposed—less than half the mortality rate of our mystery event.
Figure 1.1. Social and Demographic Characteristics of the Population at Risk and Death Rates for Each Subgroup
While more than two-thirds of all the 2,224 people at risk died, the death rates for each of the subgroups differs dramatically: 80 percent of the men died, but only 26 percent of the women and 48 percent of the children. Social class was a powerful predictor of death: among the upper class, 38 percent died (i.e., two-thirds survived), but in the lower class, 75 percent died. The 908 people for whom social class data was unavailable seem to follow the pattern of the lower social class with the highest death rate of all, 77 percent.
Source: Population and Mortality Data from Official Commission Investigating the Event.
Was our unusual event a particular outbreak of an epidemic disease? Few long-known diseases kill such a large proportion of those who get infected (e.g., malaria eventually kills about 25 percent, but over many years). But some newer diseases (such as Ebola) kill a much higher proportion; of those who are infected with the Ebola virus, about 90 percent quickly die. So our event could be an outbreak of a new, very lethal virus that struck a village of two thousand people. Or maybe it is some sort of accident—a train or plane crash? Many plane crashes have a 100 percent mortality rate, but in some cases all survive (Sullenberger’s remarkable landing in the Hudson River in the winter of 2009, for example). In most plane crashes, many die but, on average, two-thirds survive. However, no plane holds two thousand people, so that’s an unlikely answer. But some crowded commuter trains hold more than that. Could it be a huge accident? A terrorist bombing? It could be a wartime battle, where tens of thousands can die, or the tsunami of 2008 in Indonesia, or the Haitian earthquake of 2010 that killed over three hundred thousand—huge numbers with very high death rates similar to those of our event.
But how do we account for the differences in death rate by age, gender, and social class? What disease or disaster would produce this particular pattern of death rates? One of the most common factors affecting health, life expectancy, and the risk for many diseases is gender—only women die in childbirth or get cervical cancer, but many more men get lung cancer, and most casualties of combat are still males.
In the case of our mystery event, both men and women were involved (i.e., exposed to risk), and there were many more males than females in the at-risk population—1,690 adult males (76 percent of the total) vs. 425 adult females (20 percent). Looking at the mortality data in Figure 1.1 as rates, we can see immediately that gender made a big difference in one’s chances of survival. Females were almost three times as likely to survive as males: 80 percent of the men died vs. 26 percent of the females.
What could account for that? A disease that affects both sexes but is much more lethal for men? For specific diseases, the death rates are called case fatality rates (CFRs), because the only people at risk for dying are those already diagnosed with the disease—that is, the cases. What diseases that affect both men and women would have such different CFRs for the two sexes? Maybe the sample involved in this particular event could have been exposed to the risk differently based on some differences associated with their gender—for example, a workplace where most of the men were involved in something dangerous, say, a toxic product that caused cancer. Or an accident where men and women were segregated in some way that caused the men to bear the brunt of whatever was responsible—an explosion in some part of the building they all worked in, but that housed more of the men. All but thirty of the 146 victims of the Triangle Shirtwaist fire of 1911 were young women workers, while the two factory owners—Max Blanck and Isaac Harris—fled to the roof and survived. Is that a model for our event?
Looking at mortality rates by age offers more clues. In diseases that generally affect both children and adults, usually it’s the very young and the oldest who have the highest death rates, as is the case with influenza. But that virus acts very differently depending on the strain: the disastrous 1918 Spanish flu epidemic that killed over 50 million had the highest CFR among healthy, young adult men. In our event, all that we are given is the fact that there were 109 children under twelve and 2,115 adults—so only 5 percent of the exposed population were children. But somehow they had the best chance of survival: while only 31 percent of all the adults survived, 52 percent of the children lived (a 45 percent difference in CFR). What could account for this?
Most deadly events like hurricanes and infectious diseases also strike the very old and the very young hardest—people who are the frailest and least able to fight for their own survival. Again, it could be something about the children and the women that exposed them both differentially to whatever is killing all these people—maybe some of the children were with the women who survived, being helped by them. We still need more data—especially something that would tell us more about what common feature differentiates among these 2,224 individuals with such a dangerous exposure to a potentially highly lethal risk.
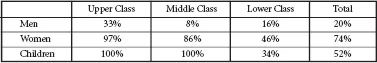
Figure 1.2. Survival Rates by Social Class for Men, Women, and Children
Women and children survived at much higher rates than men in each social class, but within these groups upper- and middle-class women and children fared much better than the lower class, and upper- and lower-class men were more likely to survive than middle-class men.
Source: Population and Mortality Data from Official Commission Investigating the Event.
The population exposed in our event was a very mixed group. Their social and economic status is given to us as upper class, 325; middle class, 285; and lower class, 706. Another group, the largest, was not classified by social class at all, but we have information that suggests they were all from either the middle or lower class. Figure 1.2 shows that for these different social groups there seems to be a clear trend: being richer increased your chances of survival dramatically. Sixty-two percent of the upper class survived, versus 41 percent of the middle class, 25 percent of the lower class, and 23 percent of the others (suggesting their risk was similar to that of the lower class).
One of the most important predictors of any population’s health is social class, which generally correlates to higher levels of income, education, and housing—all factors that confer protection against disease. We know that social class affects health and life expectancy—in the United States the poorest third of the population has a life expectancy about ten years lower than the richest third.
If we combine the risks faced by each individual, there is actually much more information to be gleaned from the data we have. Examining these factors together in a single table (as in Figure 1.2) allows us to combine several of our variables and show the risk associated with different combinations of factors. After all, that’s who we really are—we each have a gender and an age and a social class. If each operates separately to affect life and death, we may now ask, how do they work in combination in this event?
From the tables shown thus far we can see that the factors that predict better chances of survival—gender, age, and social class—seem to act together in a most dramatic way. In every social class, women were far more likely to survive than men, but upper- and middle-class women were twice as likely to survive as poorer women. For children, the effect of social class on survival was even more pronounced—all of the upper- and middle-class children survived, as compared to only one-third of the poorer children. We can now see that social class was a lifesaver. Independent of age or gender, class affected every group’s odds of survival. So maybe that is the key—or at least a link—to explaining these huge differences in chance of survival.
Hint: Location, Location, Location
While social class alone may not account for different survival rates, perhaps social class in this event serves as a proxy for something else that explains survival. Could social position reflect actual location? Sometimes the difference between life and death involves chance or circumstance—where you are seated in a car or a plane that crashes, for instance. Sometimes it’s about decisions made by people on the spot—for example, when triage is employed on the battlefield. In the World Trade Center attack, where you were located in the buildings made a huge difference in odds for survival: for those on or above the floors that the planes struck—floors 94 to 98 in the North Tower and 78 to 84 in the South Tower—over 95 percent died.
While epidemic diseases and catastrophes may take many lives, they never act in a vacuum—the social characteristics of the population have a large role in determining risk or exposure to harm. In the World Trade Center the offices on the upper floors were more expensive to rent and had the most prosperous tenants. So what could be the circumstances of our mystery event that catalyzed the effects of social class so powerfully and still conferred substantial additional protection on women and children?
By now you may be able to guess what the unusual event was that took so many lives so unequally. On April 10, 1912, the Titanic left Southampton, England, on her maiden voyage to New York City. As befit the ship’s name, Titanic was the largest ship afloat, the most luxurious ship of the day. The White Star Line called it “the safest ship ever built”—so safe that she carried only twenty lifeboats, with space for less than half of her complement of more than two thousand passengers and crew. The ship’s construction in the Belfast yards was believed to have made her unsinkable, so her lifeboats were deemed a bit of noblesse oblige—necessary only to rescue the survivors of other, less invincible ships that could actually sink. Besides, lifeboats took up valuable deck and cabin space that could be sold to passengers.
By now everyone knows that four days into the voyage, at 11:40 P.M. on the night of April 14, the Titanic struck an iceberg, tearing a hundred-yard breach below the waterline. Soon the icy water of the North Atlantic began to pour into the ship. It became obvious that many would not be able to get into a lifeboat, and the life jackets issued on deck would not offer any protection at all when passengers were exposed to water four degrees...