![]()
1 Agent-Based Modelling and Geographical Information Systems
Chapter Outline
The overarching aim of this chapter is to give the reader a contextual background and general overview of the major developments in geographical modelling for the simulation of the individual. The reader is introduced to a discussion around the purpose of modelling as well how complexity theory has influenced the way that we view (and simulate) geographical systems. We end the chapter by discussing the benefits of bringing together agent-based modelling and GIS.
1.1 Introduction
Geographers have always been interested in the role and influence of the individual within geographical systems. What are the consequences of individual behaviours and decision-making over space and time? Until relatively recently, answering this question has been beyond the reach of researchers due to a lack of appropriate data and the methods of both analysis and simulation to explore geographical systems. The last twenty years have witnessed an explosion in computer processing power and storage and micro-level data sets, accompanied by the diffusion of ideas from complexity science. This has led to new ways of thinking about and simulating geographical systems. This is clearly evidenced through the development and uptake of agent-based modelling. This approach puts the individual at the centre of the simulation. Through careful interrogation of new data sources, researchers can construct individuals who are endowed not only with basic characteristics drawn from quantitative data sets, such as age and sex, but also with more qualitative aspects such as opinions and preferences. As well as richer sources of data on individuals, these new forms of data are often spatially referenced, thus giving a greater insight into the interplay between individual and space. This is where technologies such as geographical information systems (GIS) have a role to play. These tools are well established and give the researcher the ability to manipulate and process large quantities of diverse geographical data. However, these systems are largely limited in their inability to handle dynamic processes. Almost all GIS analysis uses snapshots (i.e. static) of data. For the geographical researcher, the holy grail is a system whereby rich representations of individuals can be created and embedded within a rich (realistic) environment. This is where agent-based modelling and GIS come in, and is the motivation behind the writing of this book.
This chapter lays the foundation for the remainder of the book by demonstrating how the infusion of ideas (notably from complexity theory) has impacted upon how we view geographical systems, in particular by allowing us to capture the heterogeneity that makes up the world around us (Batty, 2008). These concepts can be readily embedded within the framework that agent-based modelling offers (Section 1.2). It is the intention of this book to explore not only this change in thinking, but also how, through the growth of computational power, data and tools are opening up new avenues of research in geographical systems and new ways of thinking about geographical processes and problems from the bottom up. In this chapter we begin with an exploration of how complexity theory underpins this form of geographical study (Section 1.2), why there is a need to model (Section 1.3), and how data is shedding new light on geographical systems (Section 1.4). Coinciding with the growth in data and the rise of computational power, there has also been a shift in thinking about these systems, from aggregate populations to individuals that make up such populations (Section 1.5). In summarising, we will explain the rationale for bringing together agent-based modelling and GIS (Section 1.6), before Section 1.7 provides an outline of the book.
1.2 Complexity and Geographical Systems
Complexity arises when a small number of rules or laws, applied at a local level and among many entities, are capable of generating complex global phenomena: collective behaviours, extensive spatial patterns, hierarchies, etc. These are manifested in such a way that the parts do not simply sum to the activity of the whole. This way of thinking maps naturally onto how we can view geographical systems. Interest in how complexity theory can be used within geographical systems has been increasing over the past 20 years, with Manson (2001, 2007) presenting a typology for the different types of complexity that can be found within geographical systems. Of the types that Manson (2001, 2007) presented, O’Sullivan (2004) considers aggregate complexity of most interest and relevance to geography.
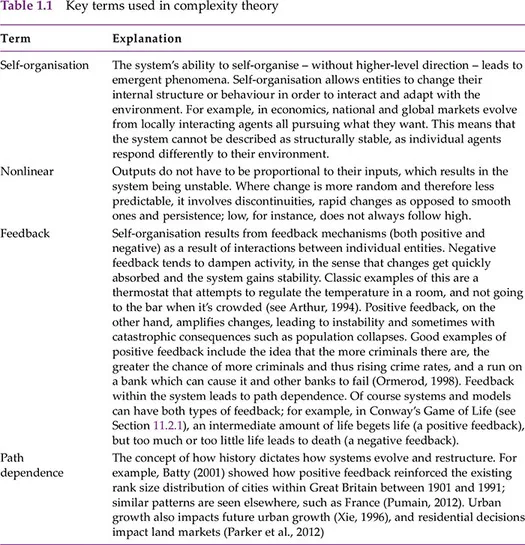
Aggregate complexity is the study of how local or micro individual elements or components interact and produce complex patterns at the global or macro level, such as collective behaviours, extensive spatial patterns, self-organisation, emergence, feedback, path dependence, and hierarchies (see Table 1.1 for an explanation of these terms). Characteristics of complex systems provide a new way of understanding geographical phenomena. Rather than pursuing a reductionist (or top-down) approach, complexity examines systems by dissecting them into logically justified components (i.e. subsystems). The complex-systems approach can be characterised by being generative (or bottom-up) (Epstein and Axtell, 1996). Phenomena of interest are studied as the product of multiple interactions among simpler basic units which correspond to identifiable entities – for example, studying the emergence of traffic jams through the modelling of individual vehicle movement and interaction (see Section 2.4.3). Individuals interact, learn and adapt from both their environments and from each other through feedback. How this can result in the emergence of patterns at the macro level through self-organisation based on what has occurred in the past is a central focus of complexity science. It highlights the need for dynamic models built from the bottom up, as opposed to models operating from the top down.
The use of complexity theory has numerous advantages with regard to our understanding and interpretation of geographical systems. Cities, for example, have long been recognised as problems of organised complexity, or as ‘people systems’ (Jacobs, 1961), in the sense that they present situations in which half a dozen quantities are all varying simultaneously and in subtly interconnected ways. Change is only noticeable when different patterns become discernible, so before change at the macro level can be observed,1 change is taking place at multiple micro levels (i.e. subsystems) simultaneously, all of which are interacting separately, contributing to a complex web of interactions.
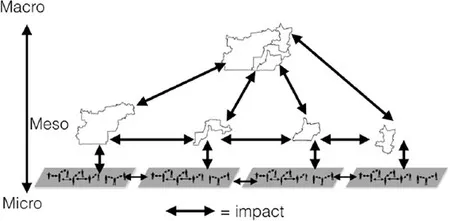
This notion of micro-level interactions in heterogeneous subsystems is often seen as one of the hallmarks of complex systems (Simon, 1996; An, 2012) and these interrelated subsystems (parts within parts) can form hierarchies. This notion of subsystems echoes those of near-decomposability (Simon, 1996): here a system (i.e. the city in this example) has multiple subsystem components (e.g. neighbourhoods) interacting among themselves, and while the interactions can be relatively weak, they are not negligible (Cioffi-Revilla, 2014). A notional idea of neighbourhoods as subsystems and the idea of near-decomposability are presented in Figure 1.1, where we have individual neighbourhoods at the micro level forming a hierarchy at the macro level (i.e. that of the city). Interactions, in this context, can be thought of as the flows of commuters from home to work locations. Simon (1996) argues that hierarchy is a fundamental property of how a complex system holds itself together: ‘hierarchical organization from the bottom up is essential for evolving systems and … hierarchical structures are the way nature and society develop robust and resilient structures’ (Batty, 2013, p. 23). But these subsystems do not operate in isolation. In the short term they might appear to be independent of the rest of the system, but in the long run they are dependent on the aggregate system behaviour. This notion of near-decomposability allows us to focus on specific subsystems within geographical systems (such as housing markets, crime, residential location) and therefore allows abstraction and focus on the problem at hand. However, we must remain cognisant that in any complex system there exist interactions between multiple subsystems.
Figure 1.1 A simple hierarchical structure of a city composed of multiple neighbourhoods which form a hierarchy at the more macro level but also have interactions (e.g. commuter flows) with each other
1.3 Models
The goal of science is to make the wonderful and the complex understandable and simple – but not less wonderful. (Simon, 1996, p. x)
In seeking to understand the complexity of the world around us, we require methods that can capture and regenerate the characteristics of complex systems. Our understanding must extend across the microscopic-, mesoscopic- and macroscopic-level drivers of these phenomena, yielding comprehensive encapsulations of these systems. To achieve this, the best tool we have available is modelling. A model can be considered as a theoretical description of the way a system or process of interest works, and is often expressed in mathematical terms (or in code). Simply stated, a model is a simplified representation of a complex reality, to the point that the reality is understandable and analytically manageable (Wilson, 1974), by representing (abstracting) one or more processes that are believed to occur in the ‘real world’ processes that exist, have existed or might exist (Longley and Batty, 2003; Miller and Page, 2007). A model can be constructed as a computer program that uses (to some degree) a simplified digital representation of one or more aspects of the real world, transforming them to create a new representation. Models differ from theories in that a theory provides a series of connected statements used in the process of explanation, while models provide an idealised and structured representation of the theory – or, as often in the case of agent-based models, they are being used to develop theory (Axelrod, 1997a).
There are many reasons and purposes for modelling: from description and explanation to prediction (for a more detailed discussion of such reasons and purposes, see Lowry, 1965; Epstein, 2008). The type of model depends on its general purpose of application. The objective of descriptive models is the explanation of phenomena by reducing the complexity of the real world to a coherent and rigorous framework to build, confirm or falsify some theory. While descriptive models might be considered abstract or ‘toy models’, such as the Schelling (1971) segregation model (see Section 2.4.1), they are often the first step in building more predictive models (see Parker et al., 2001) as they provide a way to discover new relationships. Take, for example, von Thünen’s descriptive model of 1826 (von Thünen, 1966) operationalised in digital form by Batty et al. (2004a). This simple descriptive model explains land-use patterns around a village and how such patterns can change if transportation costs are changed, and serves as a stepping stone to more predictive models of land markets and land-use change. The purpose of predictive models is to give a forecast of the phenomena under study – for example, pedestrian movement models (see Johansson and Kretz, 2012; Crooks et al., 2015a) or land-use change models (see Landis, 2001; Clarke et al., 2006).
Once the purpose and type of model has been decided (i.e. descriptive or predictive), the model needs to be created or built. A model is developed at various levels of abstraction (levels of generalisation or simplification), starting from real world concepts (high level) towards an implementation in a computer system (low level) through the process of data modelling. Data modelling is the process of structuring data about the real or artificial world. At a high level of abstraction closer to the real world object or system being modelled, it is the process of organising the real world into a well-defined and formalised set of concepts. At a lower level closer to the internal details of a computer system, it is the process of mapping these concepts onto data structures and ultimately to computer memory or disk. This progression from high-level concepts of the real world to low-level digital representation in a computer necessarily involves abstraction and formalisation. The result of the data-modelling process is a data model which can be populated by data, underpinned by a framework which maps the concepts between levels of abstraction (for more discussion on abstraction and models, see Longley et al., 2005; Gilbert and Troitzsch, 2005).
An important distinction to make is between modelling and simulation. While used interchangeably throughout the literature, there is a subtle difference. Batty (1976) writes that ‘all mathematical models which involve the use of large-scale computational facilities are referred to as simulation models’. The distinction between analytic and simulation methods with regard to modelling is that ‘analytic methods of modelling involve the use of mathematical analysis to arrive at explicit equations representing the behaviour of the system. Simulation methods are used to derive the behaviour of the system when the system is too complex to be modelled using the more direct analytic approach’ (Batty, 1976). An example of a simulation model is White and Engelen’s (1993) cellular automata model of urban land-use development over time. Wilson (2000) writes that ‘simulation is a critical concept in the future development of modelling because it provides a way of handling complexity that cannot be handled analytically’.
1.4 Data
While models provide one route towards understanding geographical complexity, we are also rapidly gaining a richer understanding of the world through the vast amount of new data becoming available and enabling new veins of research. Today we are experiencing a ‘data deluge’, and by the year 2020, many predict the global universe of accessible data to be of the order of 44 zettabytes or 44 trillion gigabytes, with no signs of slowing down (EMC2, 2014). However, within the last decade, there has been a shift in the source of this data. In the past, the main generators of digital data were government and commercial organisations (e.g. US Census Bureau, as discussed in Section 5.5) but it is estimated that app...