Our current food system has decimated rural communities and confined the choices of urban consumers. Even while America continues to ramp up farm production to astounding levels, net farm income is now lower than at the onset of the Great Depression, and one out of every eight Americans faces hunger. But a healthier and more equitable food system is possible. In Building Community Food Webs, Ken Meter shows how grassroots food and farming leaders across the U.S. are tackling these challenges by constructing civic networks. Overturning extractive economic structures, these inspired leaders are engaging low-income residents, farmers, and local organizations in their quest to build stronger communities.
Community food webs strive to build health, wealth, capacity, and connection. Their essential element is building greater respect and mutual trust, so community members can more effectively empower themselves and address local challenges. Farmers and researchers may convene to improve farming practices collaboratively. Health clinics help clients grow food for themselves and attain better health. Food banks engage their customers to challenge the root causes of poverty. Municipalities invest large sums to protect farmland from development. Developers forge links among local businesses to strengthen economic trade. Leaders in communities marginalized by our current food system are charting a new path forward.
Building Community Food Webs captures the essence of these efforts, underway in diverse places including Montana, Hawai‘i, Vermont, Arizona, Colorado, Indiana, and Minnesota. Addressing challenges as well as opportunities, Meter offers pragmatic insights for community food leaders and other grassroots activists alike.
- 289 pages
- English
- ePUB (mobile friendly)
- Available on iOS & Android
eBook - ePub
Building Community Food Webs
About this book
Trusted by 375,005 students
Access to over 1.5 million titles for a fair monthly price.
Study more efficiently using our study tools.
Information
Subtopic
AgrobusinessCHAPTER 1
The Extractive US Farm Economy
Although US population and spending power have increased steadily, net farm income has declined dramatically. Farmers were far better off a century ago. While farmers earned 40 cents from every dollar of sales in 1910, net income from producing crops and livestock has fallen to Depression-era levels. Farmers now earn only one penny from each dollar they sell—a decline of 98 percent. In the country that claims to “feed the world,” more of our food is imported than ever before. The economic structures that divide farmers from consumers systematically extract wealth from our communities. Each era in which farmers have won significantly more sales has led to further decline, not a more sustainable agriculture. Over time, the thrust of farm policy shifted from supporting market mechanisms to compensating farmers for the fact that markets were fundamentally unfair.
I have been invited to a wide range of rural communities over the past two decades, and welcomed by dogged leaders who work against great odds to weave stronger community fabrics and create healthier food systems. I am inspired by what these web weavers have accomplished with so few resources. You will read about some of their work in later chapters. At the same time, I often wonder why this work is so difficult to do, in a land of such prosperity.
I drive along midwestern Main Streets and see empty storefronts. Schools now carry hyphenated names because districts have been forced to merge to maintain a student population. I meet high school graduates who moved from rural communities to larger cities hoping to find greater opportunity. Often the county seats still boast a stately brick or stone courthouse, built more than a century ago by local craftsmen. Or they may host a grand church built by Italian stonemasons, imported for their exceptional skills—an expression of the community’s aspirations for global importance. Each edifice speaks proudly of a bold future once imagined by remote small towns that barely had automobiles. That vision is long dispelled. Today, immense pole barns shelter half-million-dollar combines, within sight of lonely main streets. Trouble signs are the deepest where farms are largest, and where the myth that “America feeds the world” is the strongest. This chapter explores how rural America became hollowed out.
More Mouths to Feed, More Money to Spend, and Fewer Farms
The US population expanded from 92 million in 1910, about the time those aspiring civic edifices were built in midwestern towns, to 328 million in 2019. Personal income rose even faster, from about $1 trillion in 1910 (in 2017 dollars) to $17 trillion in 2017. Today consumers spend more than $1.7 trillion of that income buying food each year. That amounts to $850,000 per each of the farms that survive in the US.
With more mouths to feed, and the average household having more money to spend, it would seem that the US is well poised to support farmers generously, and to create whatever food system it chooses to create. Yet 12 percent of US households are now considered food insecure by the US Department of Agriculture (USDA). That tally measures the number of households that wonder, at some point during the year, whether they will have enough to eat.
Meanwhile, curiously, much of the political discourse about agriculture focuses on ways to export more food. In 2017, US farmers exported $47 billion of bulk commodities. This was only 13 percent of the commodities farmers sold. In the same year the US imported $33 billion of bulk food commodities. That is, net exports totaled $14 billion, only 4 percent of the value of the commodities farmers sold.
If our farmers are indeed feeding the world, it is not working out that well for farmers. By 2018, the net cash income from producing crops and livestock fell to $4 billion, lower than Great Depression–era levels, and only 1 percent of sales. USDA economists report that midwestern corn farmers are losing more than $60 per acre growing corn, losing $100 per acre of wheat, and gaining only $10 per acre growing soybeans. These are three of the main US export crops. I will offer more detail on this later.
Even though policymakers pursue new export markets, opportunities for new farmers wane. As Figure 1.1 shows, the US has hosted a fairly steady number of farms since 1990, about 2 million. This was a marked decline from the 6.3 million farms that grew food in the US in 1910. In some respects this demonstrates a triumph of efficiency. We have one farm for every 164 people today, compared with one farm for every 14 people a century ago.
However, most of today’s farms, rather than growing food for their neighbors, are producing raw commodities, such as feed corn, cattle, and milk. If not exported, these are largely processed, whether to feed animals, to create consumer goods, or for industrial use. In short, farms mainly grow raw materials, not food items. Less than 1 percent of what farmers sell goes directly to household consumers. Farmers have been told that they hold a competitive advantage when they grow these commodities, and an entire system of supports has been established to encourage them to do so. But net income persistently declines.
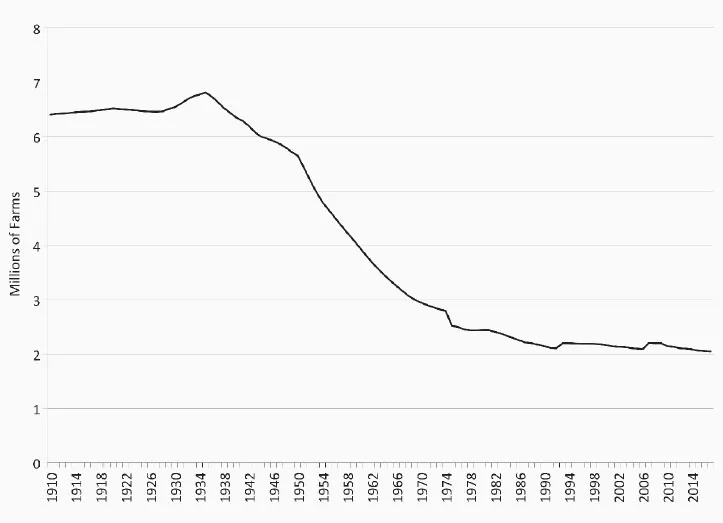
Figure 1.1. Farms in the US, 1910–2017. (USDA National Agricultural Statistics Service)
Net Cash Income for Farmers Erodes
A century ago, when farmers produced food for themselves and for households near their farms, they fared better economically. Figure 1.2 shows farm income and production expenses since that period, compiled by the USDA Economic Research Service.
This chart portrays the dramatic expansion of the farm economy we have experienced, with sales rising 62-fold over the century. Yet production costs rose even faster than cash receipts—a 100-fold increase. Thus there has been no real improvement in net cash income. This now stands at levels similar to 1983 and 1999, two of the most difficult years farmers have ever experienced, and even lower than during the Great Depression (1932). This occurred despite massive improvements in technology, scientific expertise, and productivity.
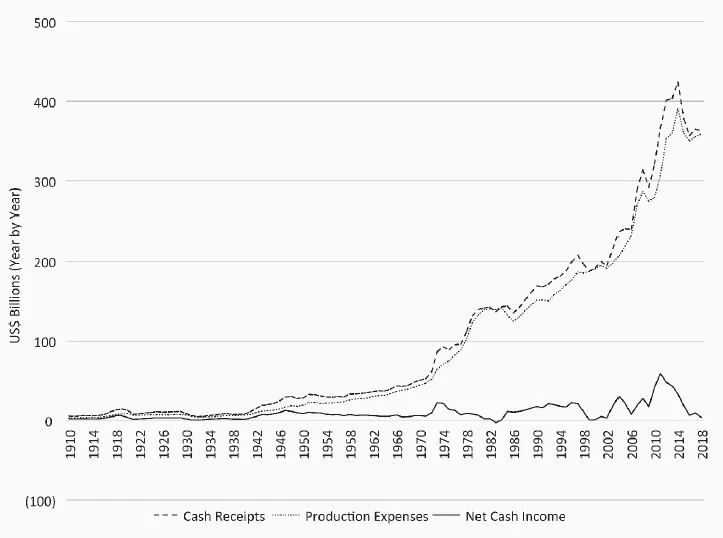
Figure 1.2. Net cash income for US farms, 1910–2018. (USDA Economic Research Service. Farm Income and Wealth Statistics. Current dollars, using the value of the dollar in each year data were reported.)
The era from 1910 to 1914 is still known by agricultural economists as the golden era of US agriculture, when prices were predictable and high for several years running. In those days, many crops were grown to feed or bed horses that labored in the fields, or to nourish livestock raised on the same farm. A wide variety of grasses were cultivated for feed, to build soil fertility, and to reduce weed pressure.
Since the US was one of the world’s few large-scale producers, the country could set its own terms for food trade. The net cash income of farming was $2.2 billion (or $56 billion in 2018 dollars). This means that for every dollar of food products farmers sold, they earned 40 cents. Today net income stands at $4 billion. That is only one penny for every dollar sold.
Farmers earned more than they do today because both commodity prices and food prices were high. A pound of butter cost 39 cents, the equivalent of $9.63 per pound today, while a dozen eggs sold for $8.89 in today’s dollars. Much of what farmers raised was reserved for home use, or used in the farm operation. Farm families kept about 10 percent of their products to feed themselves, and they also bartered with neighbors. Only 42 percent of the butter farmers churned was actually sold.
Growing for export was only one option among many a farm could exercise, including feeding one’s own family; trading with neighbors; raising food for one’s draft horses or livestock; growing green manure crops to improve the soil; or selling to a grocer, wholesaler, or processor. Farmers, in short, enjoyed greater choice as well as greater income. It seems likely that this diversity of choice helped fuel profitability.
Conditions were so different then that it is worth taking a moment to understand the rural economy of that era. At the time, 54 percent of the US population lived in rural areas. The average farm size was 138 acres, with a financial value of $6,444 ($159,000 in 2018 dollars). Over 62 percent of the farms were owned by the farm operator. Two of every three of these owned farms were free from mortgage debt, even though the country had gone through waves of recession during the previous 40 years.
The US economy was centered in large part around farming in 1910, but inequalities plagued that post-Reconstruction era. Nearly all (97%) of farm property was owned by Whites, even though people of color ran one of every seven farms (14%). This meant that many skilled farmers lacked wealth. More than 98 percent of the country’s Black farm operators lived in the South, and three-fourths of these were tenant farmers. Only 24,000 farm operators were Native American, even fewer were Chinese or Japanese.
Thus the data I highlight in this chapter tell a story that primarily depicts the lives of those privileged enough to own land. Average debt for a farm that was mortgaged was $1,715 ($42,000 in today’s currency), 27 percent of the value of a typical farm. Interest rates ran about 6 percent for mortgage loans with 5-year terms, with rates varying from region to region. Often farmers who had the means loaned money to their neighbors. Farmers trusted each other more than they trusted banks, which were often viewed as privileged firms that drew wealth out of their communities.
I should add that when I measure net cash income, I am making a different calculation than the USDA Economic Research Service typically makes. When the agency measures net income, it includes other sources of income, such as the value of stored inventories of crops or livestock. These are important to track, but I get a valuable perspective by examining whether the act of growing commodities actually pays for the costs of farming.
Adjusting for Inflation Reveals Different Patterns
As I hinted earlier, it is also important to adjust these counts for inflation, because the cost of living has eroded the value of the US dollar. In fact, a dollar earned in 1910 would be worth US$25 today. Figure 1.3 shows the same farm income data presented in Figure 1.2, but adjusted for inflation using the US Federal Reserve Bank’s consumer price index. Showing data this way offers a picture of how hard farm families had to work over the past century to earn the dollar we use today.
After this adjustment is made, new insights emerge from the same data set. Growth in cash receipts seems farm more muted once dollars are held constant. Net income declines even faster. Most notably, after accounting for inflation, four periods of farm prosperity become visible: (1) the golden era of 1910–1914 described earlier, and followed by sales spurred by World War I through 1920; (2) the period during and immediately after World War II when wartime and recovery-era sales and new technology combined to boost farm income; (3) the OPEC oil crisis of 1973–74, when the US sold massive shipments of grain to the USSR in order to retrieve dollars that had been spent purchasing oil at rising prices; and (4) the global housing debt crisis of 2008–11 when speculators’ bidding up the price of grains and rising ethanol use conspired to create a commodity price bubble.
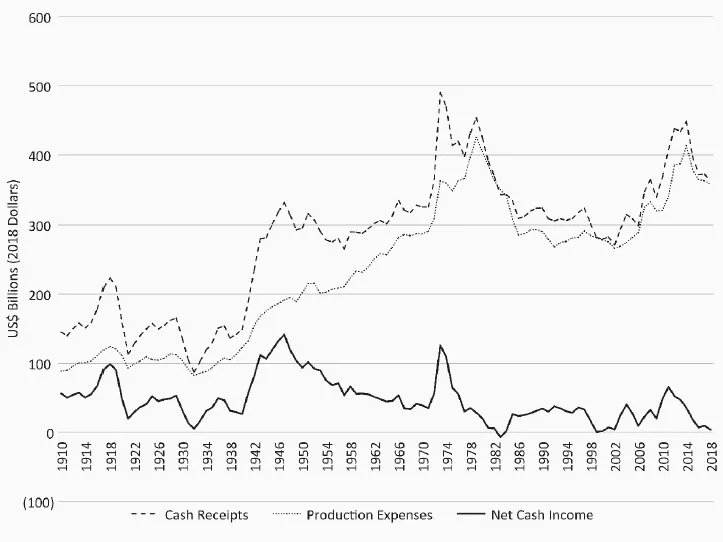
Figure 1.3. Adjusted net cash income for US farms, 1910–2018. (USDA Economic Research Service Farm Income Balance Sheet data. Adjusted for inflation using 2018 dollars.)
This adjusted chart shows that the only truly prosperous periods for US agriculture were due either to global market power (periods 1 and 2), now lost as other nations became competitive producers, or to external shocks (periods 1–4). Each bubble led to decline in the following years, not to lasting prosperity for the farm sector. Given how much these markets have been shaped with federal subsidies, tax incentives, and infrast...
Table of contents
- Cover
- Title Page
- Copyright
- Dedication
- Contents
- Acknowledgments
- Introduction
- Chapter 1. The Extractive US Farm Economy
- Chapter 2. Co-learning Is Contagious
- Chapter 3. Invoking Traditional Wisdom to Recover from Plantation Agriculture
- Chapter 4. Building the Capacities and Voice of Low-Income Residents
- Chapter 5. Placing Food Business Clusters at the Core of Economic Development
- Chapter 6. The Cradle of Food Democracy: Athens (Ohio)
- Chapter 7. Metro-Area Farmers Need Supportive Networks
- Chapter 8. Municipal Officials Collaborate to Protect Metro Farmland
- Chapter 9. Working Below the Radar to Create Networks of Green Space
- Chapter 10. Building Market Power for Farmers
- Chapter 11. Shifting from “Local Food” to “Community-Based Food Systems”
- Chapter 12. Scale Is Both the Problem and the Solution
- Conclusion. Building Community Food Webs: Action Networks, System Levers, and Business Clusters
- Definitions
- References
- Index
- About the Author
Frequently asked questions
Yes, you can cancel anytime from the Subscription tab in your account settings on the Perlego website. Your subscription will stay active until the end of your current billing period. Learn how to cancel your subscription
No, books cannot be downloaded as external files, such as PDFs, for use outside of Perlego. However, you can download books within the Perlego app for offline reading on mobile or tablet. Learn how to download books offline
Perlego offers two plans: Essential and Complete
- Essential is ideal for learners and professionals who enjoy exploring a wide range of subjects. Access the Essential Library with 800,000+ trusted titles and best-sellers across business, personal growth, and the humanities. Includes unlimited reading time and Standard Read Aloud voice.
- Complete: Perfect for advanced learners and researchers needing full, unrestricted access. Unlock 1.5M+ books across hundreds of subjects, including academic and specialized titles. The Complete Plan also includes advanced features like Premium Read Aloud and Research Assistant.
We are an online textbook subscription service, where you can get access to an entire online library for less than the price of a single book per month. With over 1.5 million books across 990+ topics, we’ve got you covered! Learn about our mission
Look out for the read-aloud symbol on your next book to see if you can listen to it. The read-aloud tool reads text aloud for you, highlighting the text as it is being read. You can pause it, speed it up and slow it down. Learn more about Read Aloud
Yes! You can use the Perlego app on both iOS and Android devices to read anytime, anywhere — even offline. Perfect for commutes or when you’re on the go.
Please note we cannot support devices running on iOS 13 and Android 7 or earlier. Learn more about using the app
Please note we cannot support devices running on iOS 13 and Android 7 or earlier. Learn more about using the app
Yes, you can access Building Community Food Webs by Ken Meter in PDF and/or ePUB format, as well as other popular books in Politique et relations internationales & Agrobusiness. We have over 1.5 million books available in our catalogue for you to explore.