CHAPTER 1
Visual Methods for Collaborative Food System Work
KIRSTEN VALENTINE CADIEUX, CHARLES Z. LEVKOE, PHIL MOUNT, AND DAVID SZANTO
As public and scholarly attention to food issues increases, there is a need for ongoing efforts to portray or to represent the complexities of food—those manifold crossings and re-crossings of stomachs and minds, markets and materials, power and privilege, nature and culture. Indeed, even this list falls short of the myriad influences, actors, and processes that constitute our food systems. This chapter explores visualization as a way to participate in and represent food-system complexity. While some portrayals of food aim to be “precise” or “definitive,” our interest is in methods that value process and conversation as much as output and accuracy. Such exploratory and emergent visual methods can also address challenges related to reductivism, authority, and the centralization of knowledge that are problematic in scholarly habits of representing food issues.
At a basic level, the term food system invokes a web of activities that includes growing and harvesting, processing and distribution, marketing and selling, and the consumption, disposal, and recirculation of nutrients. Using the term encourages us to attend to the interactive and interdependent network of relationships in the food world (Tansey and Worsley 1995). Yet we must equally acknowledge that there are many food systems, at many different scales: global, municipal, familial. Equally, a single human body can be considered a food system, as might the combined epistemologies of food studies. Beyond being a simple collection of components, food systems are dynamic and ever-changing assemblages of social, political, economic, and environmental elements. Some analysts have described them as “complex adaptive systems,” self-organizing groupings of heterogeneous entities that interact with and affect other complex systems (Bawden 1991; Nelson and Stroink 2014; Homer-Dixon 2011; Vandermeer 2011). The recognition of this complexity has contributed to an emerging consensus on the need for collaboration across food-related disciplines and sectors, and for methods that produce meaningful knowledge.
We argue that visualizations based on collaborative methods can address some of the limitations imposed in text-only forms of representation or in forms that represent only one perspective—conditions that are relatively common and habitual in and beyond food studies scholarship. First, because of its efficacy in creating clarity, authoritative text tends to oversimplify the messy interactivity of food systems, reducing the very dynamics that make them important to study. As John Law (2004) has said, “Clear descriptions don’t work if what they are describing is not itself very coherent” (2). Second, text is generally linear in structure, ocular-centric, and, even in collaborative work, often produced from a singular perspective. Food systems, by contrast, are cyclical, multisensory, and appear as different “constellations” of relationships (Massey 1999) depending on the positionality of the observer (on visuality and food, see Kirshenblatt-Gimblett 1999; Banes and Lepecki 2012; Howes and Classen 2013; Pauwels 2006).1 And third, because of perceived authority and finality of meaning, the audiences of textual accounts may feel less privileged to creatively interpret such forms and/or participate in refiguring the knowledge they present. Again, because of the assembled nature of food systems, a more participative method is called for.
Clearly not all text-based accounts produce such problematics, yet a shift toward graphic visual methods—particularly in representing the diverse knowledge of multiple communities—appears to be generating a valuable space in food studies (Fraley 2011; Mount and Andrée 2013). Mitchell (1996) writes that “vision is as important as language in mediating social relations, and it is not reducible to language, to the ‘sign,’ or to discourse” (47). In food and other cultural contexts, the use of images to represent experience predates the written word, but as the medium has changed (e.g., the printing press, digital technology), so too have these visualizations (Berger 1972; Samuels and Samuels 1975). For food systems analysis and transformation, engaging with visual methods raises a series of important questions: How do we represent complex food systems in ways that are effective and meaningful, yet still express their complex entanglements? How do we acknowledge and represent the temporal and spatial fluidity of food systems? How do we support collaboration in making and reimagining knowledge, without reinforcing conventional power relations? In this chapter, we unpack these questions and propose a number of ways that visualization work addresses them.
Visualizations and Their Effects
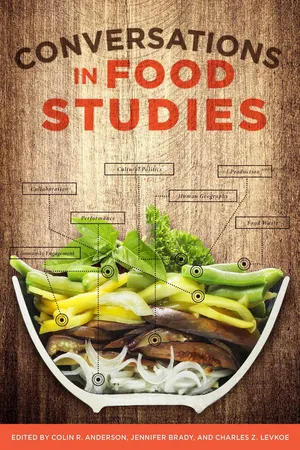
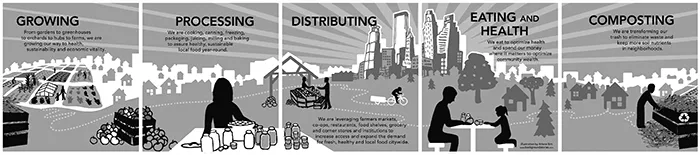
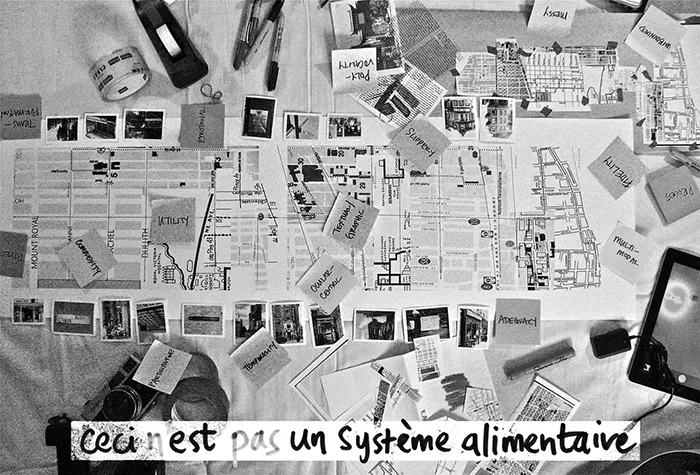
The three images that open this chapter demonstrate a range of visualizations, constituting various food ideas, design techniques, and spheres of deployment. Rather than providing comprehensive explanations about the images, we present them as a sampler, to stimulate and encourage reader interpretations about how and why they were made, as well as how and what they communicate. Clearly, many other forms of visualization also exist, such as maps, charts, graphs, and figures—those images that typically accompany scholarly texts. For this discussion, however, we focus on visuals that are more open to viewer interpretation, and which incorporate complexity and collaboration both in their methods of production and in the ways they produce and reproduce knowledge.
Three additional visualizations—which we do unpack in detail below—serve as the backbone for this chapter. Drawn from the authors’ first-hand experiences in the context of academic analysis, public conversations, and classroom teaching, they provide opportunities to exhibit and debate how visualizations can employ, translate between, and evaluate different processes in transformative food...