- 6 pages
- English
- ePUB (mobile friendly)
- Available on iOS & Android
About this book
Essential #1 best-selling reference for more than 20 years sold in almost every college bookstore in the country. The core statistics course is a critical and difficult class for many and develops a foundation that will support use of statistics in higher level courses in so many subject areas and majors. This six-page laminated guide is filled with more need-to-know facts per page than any book or website and will continue to support in future study. The equations, tables, and graphs that matter most accompany concisely written explanations in an outline format for easy access. This reference tool for students and professionals is proven to work selling millions since it's release. With the answers you need at your fingertips this durable tool will last your entire career and is an incredible value.
6 page laminated guide includes:
- Terminology
- Frequency Distribution
- Measures of Central Tendency
- Measures of Dispersion
- Graphing Techniques
- Probability
- Random Variables
- Continuous Random Variables
- Statistical Inference
- Biased & Unbiased Estimators
- Standard Error of the Mean
- Hypothesis Testing
- Central Limit Theorem
- Inference for Population Mean Using the Z-Statistic
- Inference for Population Mean using the t-Statistic
- Confidence Intervals
- Comparing Population Means
- Comparing Variances
- Analysis of Variance (ANOVA)
- Proportions
- Correlation
- Chi-Square Tests
- Hypothesis Test for Linear Correlation
- Regression
- Simple Linear Regression
- Significance of a Regression Model
- Linear Determination
- Residuals
Tools to learn more effectively

Saving Books

Keyword Search

Annotating Text

Listen to it instead
Information

In a simple linear regression model, we use only one predictor variable and assume that the relationship to the outcome variable is linear; that is, the graph of the regression equation is that of a straight line (we often refer to the “regression line”); for the entire population, the model can be expressed as: y = β0 + β1x + e y is called the dependent variable (or outcome variable), as it is assumed to depend on a linear relationship to x
x is the independent variable, also called the predictor variable
β0 is the intercept of the regression line; that is, the predicted value for y when x = 0
β1 is the slope of the regression line—the marginal change in y per unit change in x
e refers to random error; the error term is assumed to follow a normal distribution with a mean of zero and constant variation—that is, there should be no increase or decrease in dispersion for different regions along the regression line; in addition, it is assumed that error terms are independent for different (x, y) observations
On the basis of sample data, we find estimates β0 and β1 of the intercept β0 and slope β1; this gives us the estimated (or sample) regression equation ȳ = β0 + β1x
The parameter estimates β0 and β1 can be derived in a variety of ways; one of the most common is known as the method of least squares; least squares estimates minimize the sum of squared differences between predicted and actual values of the dependent variable y
For a simple linear regression model, the least squares estimates of the intercept and slope are:
estimated slope = β1 = SSxy / SSx
estimated intercept = β0 = ȳ – β1x̄
These estimates—and other calculations in regression—involve sums of squares:
SSxy = Σ(x –x̄)(y –ȳ) = Σxy – (Σx)(Sy)/n
SSx = Σ(x –x̄)2 = Σ(x2) – (Σx)2/n
SSy = Σ(y –ȳ)2 = Σ(y2) – (Σy)2/n
Ex: A simple random sample of 8 cars provides the following data on engine displacement (x) and highway mileage (y); fit a simple linear regression model
(displacement) | (mileage) | ||||
x | y | x2 | y2 | xy | |
5.7 | 18 | 32.49 | 324 | 102.6 | |
2.5 | 19 | 6.25 | 361 | 47.5 | |
3.8 | 20 | 14.44 | 400 | 76 | |
2.8 | 19 | 7.84 | 361 | 53.2 | |
4.6 | 17 | 21.16 | 289 | 78.2 | |
1.6 | 32 | 2.56 | 1024 | 51.2 | |
1.6 | 29 | 2.5... |
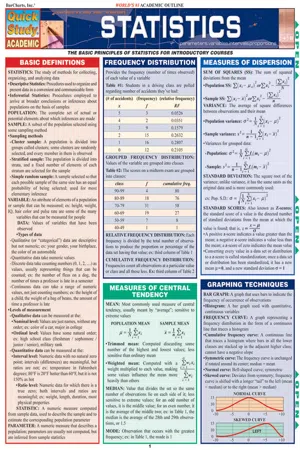
Table of contents
- Basic Definitions
- Frequency Distribution
- Measures Of Central Tendency
- Measures Of Dispersion
- Graphing Techniques
- Probability
- Random Variables
- Continuous Random Variables
- Statistical Inference
- Biased & Unbiased Estimators
- Standard Error Of The Mean
- Hypothesis Testing
- Central Limit Theorem
- Inference For Population Mean Using The Z-Statistic (σ Known)
- Inference For Population Mean Using The T-Statistic (σ Unknown)
- Confidence Intervals
- Comparing Population Means
- Comparing Variances
- Analysis Of Variance (Anova)
- Proportions
- Correlation
- Chi-Square (Χ
- Hypothesis Test For Linear Correlation
- Regression
- Simple Linear Regression
- Significance Of A Regression Model
- Linear Determination
- Residuals
Frequently asked questions
- Essential is ideal for learners and professionals who enjoy exploring a wide range of subjects. Access the Essential Library with 800,000+ trusted titles and best-sellers across business, personal growth, and the humanities. Includes unlimited reading time and Standard Read Aloud voice.
- Complete: Perfect for advanced learners and researchers needing full, unrestricted access. Unlock 1.4M+ books across hundreds of subjects, including academic and specialized titles. The Complete Plan also includes advanced features like Premium Read Aloud and Research Assistant.
Please note we cannot support devices running on iOS 13 and Android 7 or earlier. Learn more about using the app