You've just purchased a TI-84 Plus calculator to assist in performing different types of mathematical equations—now, how can you get the most out of it? You'll find the answer to this question with our comprehensive, 6-page guide that shows in great detail what exactly the TI-84 Plus can do. Function key and mode descriptions, as well as problem-solving examples, are included within a color-coded format for easy reference.

- 44 pages
- English
- ePUB (mobile friendly)
- Available on iOS & Android
eBook - ePub
About this book
Trusted by 375,005 students
Access to over 1.5 million titles for a fair monthly price.
Study more efficiently using our study tools.
Information

Graphs & Functions
When graphing functions, it is important that the mode settings match the type of data being input. To graph a function, set the type of graphing mode of the calculator to Func.
The
Defining a Function Y=
Button- To enter a function, use the Y= editor. Press Y=, use the arrow keys to navigate to the function to define, and then enter the function. NOTE: Functions may contain numbers, variables, operations, matrices, lists, or expressions. The independent variable in defined functions is X. This variable can be entered using theΧ, T, Θ, nbutton or by pressingALPHA[X].
- To evaluate a function at a given value, first define the function in the Y= editor. Then from the home screen, press VARS▶1and choose the appropriate function. Then enter the value to be evaluated (surrounded by parentheses), and pressENTERto perform the calculation.
- To select or deselect a function, press Y=. Use the arrow keys to navigate to the function to select or deselect, press◀so that the cursor is on the equals sign, and pressENTERto toggle the selection status.
- To change the graph style for a function, press Y=. Use the arrow keys to navigate to the function to select or deselect, press◀◀so that the cursor is on the graph-style icon, and pressENTERto toggle the graph style. You can change the style to a thicker line, shade above or below the graph, draw a path or animate the graph, or draw the graph in dot mode.
The
WINDOW
ButtonPressing the
WINDOW
button displays the currently displayed graph window. You can manually change the X-minimum, X-maximum, X-scale, Y-minimum, Y-maximum, Y-scale, resolution values, or Δx-values. The resolutions must be between 1 and 8. EX: An Xres of 5 evaluates the function for every fifth pixel along the x-axis.The
GRAPH
ButtonPressing the
GRAPH
button displays any functions that are selected from the Y= editor. You can zoom in on parts of the graph or change viewing windows manually or by using preset values. More information about changing how a graph is displayed can be found in The WINDOW
Button and The ZOOM
Button sections of this guide. EX: The graph of y = 0.5x3 + 1 is shown in the following screen shot of the ZStandard ZOOM
option.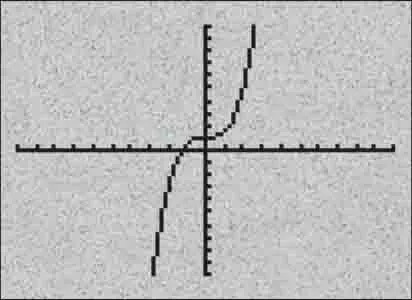
The
TRACE
ButtonPressing the
TRACE
button places a cursor on a function that is selected from the Y= editor. You can use the left and right arrow keys to move along the graph. Data values are shown at the bottom of the screen. If more than one function is displayed, the up and down arrows move the cursor to another function. The current function is indicated at the upper-left part of the screen.The
ZOOM
Button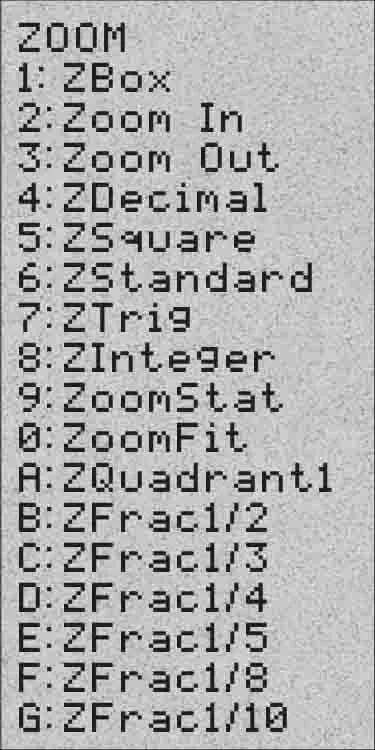
Pressing the
Zbox ZOOM
button opens the zoom menu.- To define a viewing window using Zbox, press ZOOM1. Move the cursor to a corner of the box you want to display. PressENTER. Use the arrow keys to move the cursor to the opposite corner. PressingENTERwill redraw the graph so that it fits in the box you drew.
- To zoom in on or out from a graph, press ZOOM2or3. PressENTER. The graph will zoom in or out by a factor of XFact and YFact (which are both stored in the memory and can be adjusted in the zoom memory menu).
- Pressing ZOOM4reconfigures the viewing window to an Xmin of –4.7, Xmax of 4.7, Ymin of –3.1, Ymax of 3.1, and scales of 1. This preset also changes ΔX and ΔY to 0.1.
- Pressing ZOOM5reconfigures the viewing window so that ΔX and ΔY are the same value.
- Pressing ZOOM6reconfigures the viewing window to an Xmin of –10, Xmax of 10, Ymin of –10, Ymax of 10, and scales and resolution of 1.
- Pressing ZOOM7reconfigures the viewing window to an Xmin of –6.152285613 (–47π/24), Xmax of 6.152285613 (47π/24), Ymin of –4, Ymax of 4, Xscl of 1.5707963267949 (π/2), and Yscl of 1.
- Pressing ZOO...
Table of contents
- Overview of Keys
- General Info & Basics
- Basic Calculations
- The MATH Menu
- The MATH NUM Menu
- The MATH CPX Menu
- The MATH PRB Menu
- The TEST Menu
- The ANGLE Menu
- The DRAW Menu
- The MATRIX Menu
- The LIST Menus
- The STAT Menus
- The DISTR Menu
- Graphs & Functions
- Using Applications
- Using Programs
- Using the Link Command
- Menu Shortcuts
Frequently asked questions
Yes, you can cancel anytime from the Subscription tab in your account settings on the Perlego website. Your subscription will stay active until the end of your current billing period. Learn how to cancel your subscription
No, books cannot be downloaded as external files, such as PDFs, for use outside of Perlego. However, you can download books within the Perlego app for offline reading on mobile or tablet. Learn how to download books offline
Perlego offers two plans: Essential and Complete
- Essential is ideal for learners and professionals who enjoy exploring a wide range of subjects. Access the Essential Library with 800,000+ trusted titles and best-sellers across business, personal growth, and the humanities. Includes unlimited reading time and Standard Read Aloud voice.
- Complete: Perfect for advanced learners and researchers needing full, unrestricted access. Unlock 1.5M+ books across hundreds of subjects, including academic and specialized titles. The Complete Plan also includes advanced features like Premium Read Aloud and Research Assistant.
We are an online textbook subscription service, where you can get access to an entire online library for less than the price of a single book per month. With over 1.5 million books across 990+ topics, we’ve got you covered! Learn about our mission
Look out for the read-aloud symbol on your next book to see if you can listen to it. The read-aloud tool reads text aloud for you, highlighting the text as it is being read. You can pause it, speed it up and slow it down. Learn more about Read Aloud
Yes! You can use the Perlego app on both iOS and Android devices to read anytime, anywhere — even offline. Perfect for commutes or when you’re on the go.
Please note we cannot support devices running on iOS 13 and Android 7 or earlier. Learn more about using the app
Please note we cannot support devices running on iOS 13 and Android 7 or earlier. Learn more about using the app
Yes, you can access Ti 84 Plus Calculator by Ken Yablonsky in PDF and/or ePUB format, as well as other popular books in Mathematics & Mathematics General. We have over 1.5 million books available in our catalogue for you to explore.