![]()
Part 1
Data Collection: An Introduction to Research Practices
![]()
1.1 Research and Data Collection
Doing research is much more than just gathering information or writing a description as a journalist would. Research consists in more intensive study, usually involving getting information that would surprise some audiences, and analysing the information carefully before writing up the results. The best research uses data in an original way or offers some new and exciting interpretation of existing data. Excellent research has to use evidence very carefully. Sophisticated data collection offers ways to plan and execute the best kinds of research. Many research outputs take a written form, but excellent research also results in soundbites that can be offered to practical audiences or in the media. These soundbites (punchy sentences) are only useful if the reader or listener can trace back to the original detailed research outputs, and perhaps even scan and scrutinise the data and data analysis themselves. The best researchers develop a strong reputation for systematic, logical and well-grounded research methods.
Some people argue that scientific research includes all the kinds of research that use data in sophisticated ways. But data are neither necessary nor sufficient for research to be scientific. Data are not sufficient because one also needs a carefully developed scientific argument. In this book, ways of developing good arguments are suggested and these rely in part on planning the whole research process before one starts to collect data. In some areas of research the phases of data collection and data generation are hard to distinguish because the data may already exist in newspapers or government publications, but one needs to be selective and propose that we use some of these resources. We then say that we are generating a dataset as a subset of the existing information. A good scientific researcher is likely to be able to generate or create datasets that are useful for scientific arguments. Data are also not necessary for all scientific arguments, because some arguments take the form of a normative or theoretical statement. Deductive arguments in particular may not require data at any stage. This book focuses more on other forms of scientific inference than deduction.
Research typically begins with the identification of a problem. After some general reading, one sets up a narrow research question which can easily be addressed during a constrained period of research. A literature review must be conducted and this review may include the close study of existing data and data analyses. The researcher then proceeds to gather fresh data or reanalyse and transform existing data. For most projects, a few weeks or months of doing more analysis usually follows. This book focuses more on the data-generation stages and less on the analysis stage, but the two are a little hard to separate because of the planning involved.
Systematisation is common in research. To systematically gather data might mean to run a parallel series of interviews on two sites, or to run several focus groups on the same theme. The choice of the research theme and the narrow research question is crucial. A few researchers in areas of sociology or philosophy may succeed merely by thinking about the issues and the works of previous thinkers. Even here, however, the works of earlier writers appear as a kind of data for the analyst. The vast majority of other researchers across the social and management sciences, medicine and health research, psychology and other topics have to collect and manage data as a crucial part of their research effort. Doing research may require the production of a project proposal to underpin a successful funding bid. Data collection may arise within the project proposal or may occur across a wider set of activities which we might call a programme. For example, one laboratory or institute may focus on how to utilise a longitudinal dataset or a set of cases arising from clinical meetings with patients. The research programme will then typically involve a series of smaller projects. Doctoral research often fits within wider research programmes. The degree of Ph.D. is awarded for scholarly research contributing new knowledge in a particular subject area. This degree requires between three and seven years of study. Other research projects take just weeks or months of work.
These brief notes on research do not do justice to the huge debate about what counts as scientific research. I have aimed here to introduce the various roles that data collection can play within the whole research process.
![]()
1.2 Findings
When a research project is written up and nearing completion there is often a moment of angst and concern about the main findings. Some of the stumbling blocks at this stage of a project can be over what to say, what nuances to place on different findings, who takes responsibility for these findings and how to integrate teamwork into an agreed document or presentation. The final stage needs to be foreseen during the data-collection stage so that when there are doubts, there is some recourse to the data or the data-analysis artefacts. Perhaps the data are a bit like the map that helps steering a course in a boat. The captain and crew decide where they want to go, then use the map to ensure they choose a reasonable and sensible way to reach the safety of harbour and complete their journey. Avoiding falsehoods, overcoming difficulties of comprehension, and translating between different dialects or lay idioms are all important ways that ‘data’ can help the researcher or research team avoid ending up like the Titanic – that is, at the bottom of the ocean.
The findings from a good study can usually be represented concisely on a single page in a diagram or other summary statement (as advised by Miles and Huberman, 1994). This advice given by Miles and Huberman was meant for qualitative researchers only, but it is good guidance for all kinds of social researchers. It helps to think of this aim as requiring conciseness, focus and a certain narrowness of the main topic of the research. Most researchers base their ‘findings’ closely on their research question (see Wisker, 2008: ch. 5). Some, however, revise the research question as they go along. These people tend to get into difficulty when writing up because it may become unclear what exactly they are focused on. Therefore, in writing up your findings a good guidance is first to answer the original research question and then make additional comments about exploratory aspects of the findings and new proposals for future research.
It is often easier for a lone writer to achieve a good write-up or presentation because they do not have to be monitored or influenced by others. On the other hand, the lone author runs a risk of making arguments that others will find ridiculous or unsubstantiated. It is always a good idea when developing a draft to ask at least three people to read it early on. For those working in teams, individuals can write drafts and sections and pass them around. Guidelines for co-authoring can set out the roles team members may play (British Sociological Association (BSA), 2002). For example, one person might be a ghost writer and not want attribution, while another who collects data may want to be a named co-author. In general, the BSA tends to discourage ghost writing and suggests instead that the lead author may have a number of named co-authors, including the paid writer, who then get to claim joint authorship and take a fuller role in finalising the report. The BSA also encourages data enumerators and interviewers to become named authors. The guidelines argue that to be a named co-author of findings, each person needs to be aware of the whole paper’s arguments and to have gone over the whole text in detail at a late stage to make comments, insertions and corrections. As long as this has happened, some co-authors can have a relatively minor role in writing up but may have had important roles during data collection.
Some findings will probably ‘emerge’ from a study without being expected or predicted in advance. The ‘expected’ findings might follow the usual pattern of normal science. ‘Normal science’ is a special phrase referring to the use of standard, pre-planned methods on a routine study topic to get results that to some extent (in broad outline) could have been predicted from the start. Kuhn (1970) saw normal science as rather conventional and pointed out that the very best science goes beyond normal science. Anomalies and situations that are new, unique or difficult to explain cause scientists to seek new, creative, innovative explanations or interpretations. Now the same dataset could be the basis of a new set of findings! This exciting vista, set out by Kuhn as paradigm change but also studied by many other authors since Kuhn’s time (Fuller, 2003), offers researchers a wide range of ways to deviate from normal science.
Although there are connections (and rootedness) between the data collected and the findings, there is not a single mapping from one to the other. If we stay with our sailing analogy, there are many ways to reach the other side of the ocean. Social science archives (where data are held for future users) offer opportunities for reanalysing older data, comparing it with new data and perhaps applying new interpretive strategies. Thus there is not a single set of findings from one study. Tolerance, pluralism and even-handedness are needed when we realise that different researchers might develop different findings from the same dataset.
According to Kuhn (1970), the hypothesis-testing tradition led to a great pretence of attempts at falsification when in fact the underlying basic theoretical premises were never questioned. As a result, some scientists now avoid the hypothesis-testing methodology. I offer several approaches to this issue in this book. For example, you could be a qualitative researcher developing new hypotheses. You would, of course, test them at the same time and offer sensible claims. But no quantitative research would be involved. If you were a quantitative survey researcher you might test a wide range of hypotheses and tell the reader what you have found out. A mixed-methods researcher has to weave a pathway delicately around these options. Some researchers now do a little of both. In rough terms we might call the first ‘exploratory’ findings and the second ‘tested’ findings or simply ‘hypothesis-testing’. In order for it to make sense to do both, one needs to leave the tradition described by Popper in which falsification played a central role. One should take responsibility for choosing theories and decide on which set of basic assumptions to work with. Kuhn argued correctly that falsification was not value–neutral in general (Fuller, 2003, 2005). Researchers today, such as the textbook authors on research design, see mixed methods as highly feasible and desirable (De Vaus, 2001; Teddlie and Tashakkori, 2009; Creswell and Plano Clark, 2007; Creswell, 2003, 2009). Advice has tended to move away from the traditional separation between a value-neutral survey method and a value-saturated qualitative method.
I wonder whether the word ‘findings’ tends to suggest a consensual set of conclusions and so denies the possibility of contesting the results? In recent years it has become clear that many of the basic words and phrases used in social science are essentially contestable. Examples such as human rights, civil society, rational choice and market optimum are obviously controversial for those who do (or do not) adhere to the underlying values that they imply. Social science is not generally considered to be value-neutral any more. Specific concrete sentences may be factual but an overall argument usually has values (whether explicit and/or implicit), a purpose, underlying assumptions and a persuasive undertone (Olsen, 2009).
The most exciting writing certainly has a purpose. This chapter on findings is meant to excite you about the prospect of doing research, even knowing in advance (with trepidation) that the findings are going to be contestable! Having this clear purpose, I can write in a well-informed, focused and informative way: that is what good research is like too. Researchers use evidence as part of their arguments but in a way that other writing does not. So there are necessary connections between the data-collection plan and the goal or horizon of the kinds of findings that are expected from your study.
To summarise: research findings may be controversial but need to fit into an argument that is clearly stated, well grounded with evidence and suitable for further discussion and development by others. Research data can be put into a data archive to enable early findings to be reassessed later. Using tolerance, researcher teams can develop agreed findings even when they are not wholly unanimous about some aspects of policy or values. Using pluralism (which will be discussed in more detail later on), researchers can explore the usefulness and validity of competing theories in an environment that accepts that more than one theory may have a ‘purchase’ on events or a telling insight to offer. Hypothesis testing and falsification are not the bread and butter of social science even if they are, at times, very important.
![]()
1.3 Data
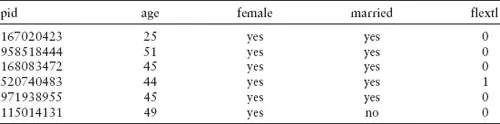
Data are disembodied information. Data are not the same as knowledge. My favourite type of data is interview transcripts. These are rough and raw – often embarrassingly so – but they reveal a lot about a scene to the close reader. The data type I use most often is survey data. Examples of these two data types, shown in Table 1 and Box 1, illustrate how top-quality researchers in the UK frame these two types of data.
Table 1 BHPS data on ID, age, sex, marital status, and flexitime – six-row sample
Note: The data are anonymised here.
Box 1 Extract from a Transcript of a Three-way Interview
Topic: Television industry contractual terms
Length: 18 pages single spaced
Interview ITV Company 15 March 2000
Interviewees:
| Person 1: | Researcher in the TV industry, female aged 22. Single. Recently graduated from Cambridge with good degree in politics. Short term contract. |
| Person 2: | Post-production/video tape library, male aged 43. Married with one child. Permanent staff in the TV industry. |
| ‘Me’ is the interviewer Valerie Antcliff. |
| Me: | The first thing I’d like to ask you is how secure you feel in your current position? |
| Person 1: | Not very at all! I graduated last year so this is my first sort of proper job and to begin with I was clearly – oh well this is what happens, you’re on three month contract, I mean I’ve just been told that my contract ends at the end of April and my next contract sort of goes up until the end of June and that’s it, so essentially |
| | from June I’ll be unemployed. Now that’s because the series I work on will finish in June, but other things will come up that I can possibly go on to that will last over the summer, but there isn’t that guarantee and actually it is rather an odd feeling, yes technically I could be unemployed in June. |
| | The way I’ve sort of looked at it is, well I do actually enjoy the job I do but if something else comes up I’m not tied to it because I’ve not signed a year-long contract like a lot of my friends who got jobs when they graduated have. |
| | They sign these great big, long contracts to sort of be there for ever and ever and me, I’m kind of in the reverse of that. But it is slightly unnerving because there is that sense that you think well if they think I’m totally terrible, well they will just get rid of me overnight. |
| Me: | So do you think it could work to your advantage? If a better job comes up.… |
| Person 1: | It works to my advantage because I come into the job knowing I’m not going to be there for very long… |
These two examples are chosen to illustrate the two extremes of ‘hard’ and ‘soft’ data. People usually mean by hard data the highly structured questionnaire data types. The hardness comes from answers being placed rigorously into categories, as seen in Table 1. These categories are set up to have the same meaning across the whole sample. In the case of the British Househol...