![]() Part One
Part One
Measurement![]()
ONE
Introducing measurement
Chapter Overview
This chapter will:
• Introduce some useful jargon – units of analysis, variables, values.
• Describe different levels of measurement – nominal, ordinal, interval.
• Show how to identify the overall pattern in a set of data by asking: (i) What’s the most typical value? (ii) How do the rest of the values spread out around it?
Social researchers study three broad areas: (i) what people think (e.g. their attitudes, values, prejudices), (ii) what people do (e.g. their behaviour as voters, consumers, workers), and (iii) what people are (e.g. their age, social class, health status). Social researchers collect information in two basic ways: (i) they ask people questions; and (ii) they observe people, either directly or indirectly through the things they’ve made.
For example, imagine that you are interested in researching movies. Thus, movies are the units of analysis. If you go to the comprehensive Internet Movie Database, you can find answers to a range of questions about each movie. For example:
• Where was the main film studio located?
• What was the classification rating for public exhibition?
• What was the length (or running time) of the movie?
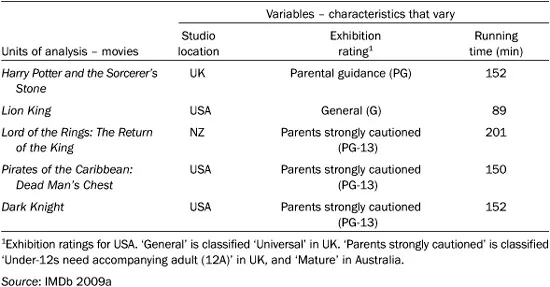
As Table 1.1 shows, there is a variety of answers to each question. For example, the main film studio for Harry Potter was in the UK, while that for the Lion King was in the USA. A characteristic that varies (e.g. studio location) is a variable. The numbers or words used to measure the variable are values (e.g. UK, US). Together, values are referred to as data. These bits of jargon are useful to remember.
Table 1.1 shows information about three characteristics for 5 of the 100 most commercially successful movies. Using the jargon, Table 1.1 shows data about three variables for five units of analysis. Notice that numbers alone occur in just one column. Variables described by numbers are numerical variables (or quantitative variables). The other columns contain category names instead of numbers. Variables described by category names are categorical variables (or qualitative variables). The next section looks in more detail at the various levels at which you can measure variables.
Table 1.1 Units of analysis, variables and values
Levels of measurement
One of the simplest ways to analyse the information about the movies’ Studio location is to label boxes with the name of each country listed in the 100 database records. You write out each film’s studio location on a separate card, and place the card into the appropriate box (e.g. all the US cards go into the box marked ‘USA’). When you have distributed all 100 cards, it’s easy to count the number of cards in each box, and see how many films were made in the USA, how many in the UK, and so on. You can then order the boxes from the one with the largest number of cards to the one with the smallest number.
Notice, however, that you can put the countries into order only after you’ve finished counting the cards. Before counting, you can put the boxes showing the countries in any order (e.g. USA, UK, NZ…; or UK, NZ, USA…). All you can say about the different countries is that – they are different. There is no reason why you should always list them in a particular order. When categories are unordered like this, and the only thing you can say is that they have different names, the data are at the nominal level of measurement (from the Latin word nominalis, meaning ‘to do with names’).
The Exhibition rating variable on Table 1.1 is a bit different. You label one box ‘General’, another ‘Parental guidance’ the third ‘Parents strongly cautioned’, and so on if there are other exhibition ratings on the list of movies. Once again, imagine that you put the rating for each of the 100 movies on a card, and then put each card into the appropriate box. You then count the number of cards in each box.
However, the difference between exhibition rating and studio location is that you can put the rating boxes in order before you distribute the cards. The ratings are categorised in terms of how explicitly the films depict violence, sex, and so on. Thus, a movie rated ‘Parents strongly cautioned’ is more explicit than one rated ‘Parental guidance’ (PG), and a PG-rated film is more explicit than one rated ‘General’ (G). So, not only are the categories different, but they also have a built-in order – an order that is apparent before you begin the counting process. When you can order the categories in this way, the data are at the ordinal level of measurement. Notice, however, that although you can say that a PG-rated film is more explicit than a G-rated film, you can’t say how much more explicit.
BEHIND THE STATS
One bizarre story that centres on ordinal level of measurement originated in 2006 when the International Astronomical Union (IAU) downgraded Pluto from a full planet to a dwarf planet. This led to a remarkable outcry, including a petition calling on the IAU to reverse the decision (PleaseSavePluto 2008). It generated a new word, to be plutoed, meaning to be demoted or devalued, which was the American Dialect Society’s ‘Word of the year’ in 2006 (ADS 2007). In 2008, the IAU in part bowed to this pressure, and introduced a new class of planets, plutoids, lying between full planets and dwarf planets, the founding member of which is – Pluto (IAU 2008). Smaller than dwarf planets are the minor planets, of which 15,000 have been named. There are many mnemonics (memory aids) for the order of the planets from the Sun. The one I use is: My Very Easy Memory Jogger Still Uses Nine Planets (Mercury, Venus, Earth, Mars, Jupiter, Saturn, Uranus, Neptune, Pluto).
Table 1.1 also shows each movie’s Running time in minutes. You can follow the same procedure as before, labelling boxes (e.g. ‘152’, ‘89’) and placing each film into the appropriate box. However, these running time values are very different from the studio location and exhibition rating categories. The difference between any pair of numbers not only shows that one movie is shorter or longer than the other, but also shows how much shorter or longer. For example, you know that a 152 minute movie is 63 minutes longer than an 89 minute movie. When you can measure the difference (or ‘interval’) between any two values, the data are at the interval level of measurement.
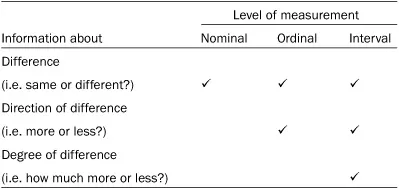
Table 1.2 summarises the type of information given by variables at the nominal, ordinal, and interval levels of measurement. Clearly, interval data contain more information than ordinal data, and much more than nominal data.
Social researchers are most likely to work with nominal data. For example, a recent Census form contained approximately 50 questions, three-quarters of which asked for nominal-level answers. Table 1.3 shows some of them. The level of measurement is very important because what types of analysis researchers can do is very dependent on what sort of data they have. This is why there are separate chapters in this book for numerical (i.e. interval) variables and categorical (i.e. nominal and ordinal) variables.
Table 1.2 Information at different levels of measurement
Table 1.3 Levels of measurement – Census questions
(a) Nominal data
1 Are you male or female?
2 What is your relationship to the household head? (e.g. Spouse, De facto partner, Boarder)
3 What is your marital status? (e.g. Never married, Married, Widowed)
4 In which country were you born? (e.g. Australia, England, New Zealand)
5 What is your religion? (e.g. Catholic, Anglican, Uniting)
6 What is the main field of study for your highest qualification completed? (e.g. Plumbing, History, Hairdressing)
7 Which best describes the industry or business of the employer at the location where you work? (e.g. Manufacturing, Retailing, Health)
8 How did you get to work last Tuesday? (e.g. Train, Bus, Car)
9 In the last two weeks, did you spend time looking after a child, without pay? (No; Yes, looked after my own child; Yes, looked after a child other than my own)
10 In the last 12 months, did you spend any time doing voluntary work through an organisation or group? (No, Yes)
(b) Ordinal data
1 How well do you speak English? (Very well, Well, Not well, Not at all)
2 Do you ever need someone to help with, or be with you for, self-care everyday activities such as eating, showering, dressing or toileting? (Yes always, Yes sometimes, No)
3 What is the level of the highest qualification you have completed? (e.g. Trade certificate, Advanced diploma, Degree)
(c) Interval data
1 What was your age last birthday?
2 What is the total income you usually receive per week?
Source: Based on ABS 2006
Distributions
Spend a minute or so trying to work out what Figure 1.1 shows. Then imagine trying to describe the figure to a friend over the telephone.
If all you see is a meaningless mass of irregular grey shapes, your telephone description will be long and complicated. However, if you see the word LIFE in white on a grey background, then your description will be short and simple. Similarly, when looking at a mass of numbers or category names, your aim is to make sense of them by identifying the overall pattern. The term for this overall pattern is distribution, because...