Profit From Your Forecasting Software
eBook - ePub

Profit From Your Forecasting Software

A Best Practice Guide for Sales Forecasters

  1. English
  2. ePUB (mobile friendly)
  3. Available on iOS & Android
eBook - ePub

Profit From Your Forecasting Software

A Best Practice Guide for Sales Forecasters

About this book

Go beyond technique to master the difficult judgement calls of forecasting

A variety of software can be used effectively to achieve accurate forecasting, but no software can replace the essential human component. You may be new to forecasting, or you may have mastered the statistical theory behind the software's predictions, and even more advanced "power user" techniques for the software itself—but your forecasts will never reach peak accuracy unless you master the complex judgement calls that the software cannot make. Profit From Your Forecasting Software addresses the issues that arise regularly, and shows you how to make the correct decisions to get the most out of your software.

Taking a non-mathematical approach to the various forecasting models, the discussion covers common everyday decisions such as model choice, forecast adjustment, product hierarchies, safety stock levels, model fit, testing, and much more. Clear explanations help you better understand seasonal indices, smoothing coefficients, mean absolute percentage error, and r-squared, and an exploration of psychological biases provides insight into the decision to override the software's forecast. With a focus on choice, interpretation, and judgement, this book goes beyond the technical manuals to help you truly grasp the more intangible skills that lead to better accuracy.

  • Explore the advantages and disadvantages of alternative forecasting methods in different situations
  • Master the interpretation and evaluation of your software's output
  • Learn the subconscious biases that could affect your judgement toward intervention
  • Find expert guidance on testing, planning, and configuration to help you get the most out of your software

Relevant to sales forecasters, demand planners, and analysts across industries, Profit From Your Forecasting Software is the much sought-after "missing piece" in forecasting reference.

Frequently asked questions

Yes, you can cancel anytime from the Subscription tab in your account settings on the Perlego website. Your subscription will stay active until the end of your current billing period. Learn how to cancel your subscription.
At the moment all of our mobile-responsive ePub books are available to download via the app. Most of our PDFs are also available to download and we're working on making the final remaining ones downloadable now. Learn more here.
Perlego offers two plans: Essential and Complete
  • Essential is ideal for learners and professionals who enjoy exploring a wide range of subjects. Access the Essential Library with 800,000+ trusted titles and best-sellers across business, personal growth, and the humanities. Includes unlimited reading time and Standard Read Aloud voice.
  • Complete: Perfect for advanced learners and researchers needing full, unrestricted access. Unlock 1.4M+ books across hundreds of subjects, including academic and specialized titles. The Complete Plan also includes advanced features like Premium Read Aloud and Research Assistant.
Both plans are available with monthly, semester, or annual billing cycles.
We are an online textbook subscription service, where you can get access to an entire online library for less than the price of a single book per month. With over 1 million books across 1000+ topics, we’ve got you covered! Learn more here.
Look out for the read-aloud symbol on your next book to see if you can listen to it. The read-aloud tool reads text aloud for you, highlighting the text as it is being read. You can pause it, speed it up and slow it down. Learn more here.
Yes! You can use the Perlego app on both iOS or Android devices to read anytime, anywhere — even offline. Perfect for commutes or when you’re on the go.
Please note we cannot support devices running on iOS 13 and Android 7 or earlier. Learn more about using the app.
Yes, you can access Profit From Your Forecasting Software by Paul Goodwin in PDF and/or ePUB format, as well as other popular books in Computer Science & Decision Making. We have over one million books available in our catalogue for you to explore.

Information

Publisher
Wiley
Year
2018
Print ISBN
9781119414575
eBook ISBN
9781119416005

CHAPTER 1
Profit from Accurate Forecasting

1.1 THE IMPORTANCE OF DEMAND FORECASTING

Forecasts of demand for products and services can be crucial to the operations of most companies. Inventory planning, logistics planning, production scheduling, cash flow planning, decisions on staffing levels, and purchasing decisions can all depend on forecasts. Making these forecasts perform as well as possible will lead to improved customer service levels and so foster customer goodwill and retention. It will also lower costs. There will be less need for expensive emergency production runs, and there should be a reduction in the waste associated with excessive stock levels and unsold products.
Figures for the cost reductions or increased profits that companies achieve through improved forecasting can be hard to come by – most organizations don't publish them. However, one forecasting software company (www.catchbull.com) estimates that avoidable forecast errors can add between 2% and 4% to costs of production. They quote the case of one $15 billion firm where executives estimated that “we can drive up to $200 m of avoidable costs out of the business.” A survey carried out by a Triple Point Technology in 2013 indicated that reductions in inventory levels resulting from improved forecast accuracy meant that a company with a $1 billion turnover could expect savings of between $5 million and $10 million. However, the same survey found that 40% of respondents admitted that they were “not currently leveraging the advantages of statistical modeling in their demand planning operations.” Of course, it's in the interests of software companies to advertise these huge benefits, but common sense suggests that better-performing forecasts will significantly benefit a company's bottom line.

1.2 WHEN IS A FORECAST NOT A FORECAST?

A forecast is an honest statement of what we expect to happen at a future data, based on the information available at the time when we make the forecast. It is not necessarily what we hope will happen, so it is not the same as a target. In fact, in some circumstances we may be doubtful that a target will be achieved – we simply created it to motivate people to try to get as close to it as possible. Nor is it the same as a plan. A plan is what we intend to happen, assuming the future is under our control. As we shall see, ideally a forecast will acknowledge that we are uncertain about the future and provide a measure of that uncertainty.
It is also important to distinguish a forecast from a decision. A decision is what we choose to do in the light of a forecast. We may have a demand forecast for next week of 2,000 units, so we decide to hold 2,200 units in stock at the start of the week in case demand exceeds the forecast. The 2,200 units is not a forecast – it's a decision.
Sometimes people are tempted to look at the possible demand levels that may occur at a future period and decide which one will best suit their interests. For example, I might forecast a demand for next month of 3,500 units, knowing that it will please senior managers and gain me some kudos, even though I don't truly expect this demand level to be achieved. Although I might call this a forecast, in reality I'm making a decision.

1.3 WAYS OF PRESENTING FORECASTS

1.3.1 Forecasts as Probability Distributions

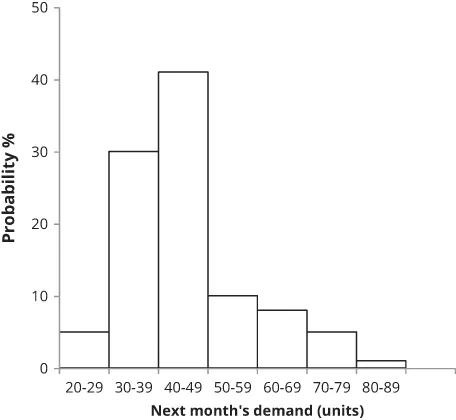
We can present forecasts in several different ways. A probability distribution indicates the possible levels of demand and their associated probabilities. Table 1.1 is an example. Figure 1.1 displays the distribution. It shows that relatively low levels of demand are more probable than very high demands, so the distribution is skewed. Forecasts in this form are useful because they show the risks of particular decisions we may make. For example, if we decide to hold 69 units of stock at the start of the month, there will be a 5% + 1% = 6% probability that we will be unable to meet demand and will disappoint customers.
Table 1.1 A Probability Distribution of Demand
Next Month's Demand (Units) Probability (%)
20 to 29 5
30 to 39 30
40 to 49 41
50 to 59 10
60 to 69 8
70 to 79 5
80 to 89 1
Graphical display of the probability distribution.
Figure 1.1 A graphical display of the probability distribution
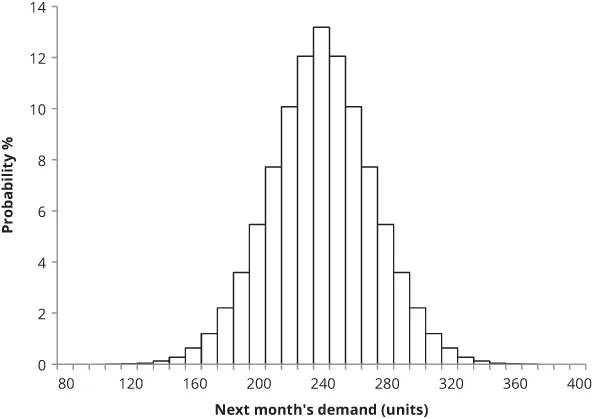
Accurately estimating probability distributions can be difficult, particularly if we have limited past data. Usually, it is assumed that a particular distribution applies and, most commonly, this is the bell-shaped normal or Gaussian distribution. Figure 1.2 shows an example. Notice that the distribution is symmetrical about its highest point. While there are theoretical reasons why a normal distribution will apply, in many circumstances it can at best only offer a rough approximation to the probabilities of future demand. When the “true” distribution is highly skewed, the approximation will be very poor.
Graphical illustration of a normal distribution of demand.
Figure 1.2 A normal distribution of demand

1.3.2 Point Forecasts

Most software products don't currently display full probability distributions (sometimes these are called density forecasts). Instead, they produce point forecasts and prediction intervals. A point forecast is a forecast expressed as a single number. It usually represents the mean (or average) of the probability distribution. Imagine if the month referred to in Figure 1.2 was repeated many times. On some occasions, we see demand greater than 300 units. On very rare occasions, it would exceed 350 units. In other months, demand might be well below 200 units. More often than not, it would be between 200 and 280. If we averaged all of the demands, we observed we would find that the mean demand was 240 units. This would be our point forecast. If we did the same for the month referred to in Figure 1.1, we would find that the mean demand was 45 units – slightly to the left of the range of possible demands because of the skewness in the distribution. Therefore, a point forecast produced by software is simply an average of all the possible levels of demand – taking into account their probabilities. It is not a statement that we think that that specific level of demand will occur – we know that the actual demand is likely to stray from its value as shown by the probability distributions. You might tell me the mean height of American males aged over 21, but I don't expect every American male I meet in this age group to be that height. In fact, meeting someone who conforms exactly to the mean would be rare.
This point is worth emphasising. I have heard of cases of senior managers who expect point forecasts always to be “100% accurate” and criticize forecasters who are not achieving this. Their attitude shows a fundamental misunderstanding of what a point forecast is. In most forecasting situations, there are bound to be random or unpredictable factors that cause the actual demand to stray from the average represented by the point forecast. In particularly unpredictable situations, such as when we forecast a long way ahead, we should not be surprised if the demand strays a significant distance from the point forecasts. However, as we will see, if we try to anticipate these random factors, we will be wasting our time and probably damaging the forecasts to boot.

1.3.3 Prediction Intervals

Point forecasts don't tell us anything about the level of uncertainty associated with a forecast. We can't tell how far actual demand might stray from the forecast, and you generally need this information to plan inventory levels. However, some idea of the level of uncertainty can be obtained from a prediction interval. A prediction interval is a range that has a stated probability of capturing the act...

Table of contents

  1. Cover
  2. Title Page
  3. Table of Contents
  4. Acknowledgments
  5. Prologue
  6. CHAPTER 1: Profit from Accurate Forecasting
  7. CHAPTER 2: How Your Software Finds Patterns in Past Demand Data
  8. CHAPTER 3: Understanding Your Software's Bias and Accuracy Measures
  9. CHAPTER 4: Curve Fitting and Exponential Smoothing
  10. CHAPTER 5: Box-Jenkins ARIMA Models
  11. CHAPTER 6: Regression Models
  12. CHAPTER 7: Inventory Control, Aggregation, and Hierarchies
  13. CHAPTER 8: Automation and Choice
  14. CHAPTER 9: Judgmental Interventions: When Are They Appropriate?
  15. CHAPTER 10: New Product Forecasting
  16. CHAPTER 11: Summary: A Best Practice Blueprint for Using Your Software
  17. Index
  18. End User License Agreement