eBook - ePub
Cultural Competence in Health Education and Health Promotion
- English
- ePUB (mobile friendly)
- Available on iOS & Android
eBook - ePub
Cultural Competence in Health Education and Health Promotion
About this book
Cultural Competence in Health Education and Health Promotion, 2nd edition, examines the importance of ethnic and cultural factors for community health practice. Edited and written by a stellar list of contributors who are experts in field, this book describes essential theories, models, and practices for working with race, ethnicity, gender, and social issues. The authors cover a wide range of topics including demographics, disparities, complementary and alternative medicine, spiritually grounded approaches, multicultural populations, culturally competent needs assessment and planning, communication, workforce, program planning, aging, sexual orientation, and future challenges. This edition has substantially expanded coverage on working with diverse groups, social determinants of health, spirituality, theoretical models for multicultural populations, planning and program evaluation, and aging, with new content includes coverage of disability and health literacy. This edition also reflects the latest standards for Certified Health Education Specialist certification and national standards on Culturally and Linguistically Appropriate Services (CLAS), from Department of Health and Human Services, Office of Minority Health
Frequently asked questions
Yes, you can cancel anytime from the Subscription tab in your account settings on the Perlego website. Your subscription will stay active until the end of your current billing period. Learn how to cancel your subscription.
No, books cannot be downloaded as external files, such as PDFs, for use outside of Perlego. However, you can download books within the Perlego app for offline reading on mobile or tablet. Learn more here.
Perlego offers two plans: Essential and Complete
- Essential is ideal for learners and professionals who enjoy exploring a wide range of subjects. Access the Essential Library with 800,000+ trusted titles and best-sellers across business, personal growth, and the humanities. Includes unlimited reading time and Standard Read Aloud voice.
- Complete: Perfect for advanced learners and researchers needing full, unrestricted access. Unlock 1.4M+ books across hundreds of subjects, including academic and specialized titles. The Complete Plan also includes advanced features like Premium Read Aloud and Research Assistant.
We are an online textbook subscription service, where you can get access to an entire online library for less than the price of a single book per month. With over 1 million books across 1000+ topics, we’ve got you covered! Learn more here.
Look out for the read-aloud symbol on your next book to see if you can listen to it. The read-aloud tool reads text aloud for you, highlighting the text as it is being read. You can pause it, speed it up and slow it down. Learn more here.
Yes! You can use the Perlego app on both iOS or Android devices to read anytime, anywhere — even offline. Perfect for commutes or when you’re on the go.
Please note we cannot support devices running on iOS 13 and Android 7 or earlier. Learn more about using the app.
Please note we cannot support devices running on iOS 13 and Android 7 or earlier. Learn more about using the app.
Yes, you can access Cultural Competence in Health Education and Health Promotion by Miguel A. P¿rez,Raffy R. Luquis,Miguel A. Pérez in PDF and/or ePUB format, as well as other popular books in Medicina & Sanità, amministrazione e assistenza pubblica. We have over one million books available in our catalogue for you to explore.
Information
CHAPTER 1
IMPLICATIONS OF CHANGING US DEMOGRAPHICS FOR HEALTH EDUCATORS
LEARNING OBJECTIVES
After completing this chapter, you will be able to
- Identify the four overarching goals in Healthy People 2020.
- Explain the demographic changes and population trends in the United States.
- Describe selected characteristics of the major racial and ethnic groups in the United States.
- Discuss challenges and opportunities for health educators.
The 1985 Secretary’s Report on Black and Minority Health for the first time authoritatively documented the health disparities that different population groups in the United States experience (US Department of Health and Human Services, 1998). This seminal report provided the basis for the Healthy People initiative, which has established ambitious health benchmarks to be achieved at the end of their respective time frames (US Department of Health and Human Services, 2011).
Healthy People 2020 establishes the current national health targets, with four overarching goals to be achieved by the end of the decade (see box 1.1). Achieving these goals depends on collaboration among sundry segments of society to ensure that Americans not only have access to superior health care services but also incorporate preventive measures, including health education, into their daily lives.
The goals established by Healthy People 2020 require an understanding of demographic shifts and their impact on the health status of selected population segments. This chapter explores the impact of demographic changes on preparing a culturally competent health education workforce. It also provides a brief description of relevant cultural characteristics of each of the major ethnic groups in the United States.
demographic shifts
Statistical changes in the socioeconomic characteristics of a population or consumer group.
BOX 1.1 HEALTHY PEOPLE 2020 OVERARCHING GOALS
- Attain high-quality, longer lives free of preventable disease, disability, injury, and premature death.
- Achieve health equity, eliminate disparities, and improve the health of all groups.
- Create social and physical environments that promote good health for all.
- Promote quality of life, healthy development, and healthy behaviors across all life stages.
Demographic Shifts
Demographic Characteristics
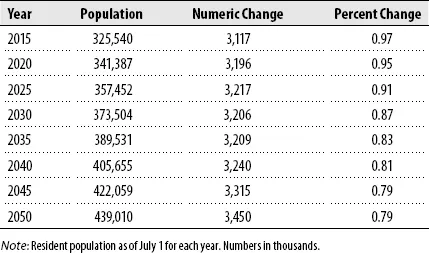
Data from the 2010 decennial census show that 308,745,538 resided in the United States in 2010 (US Census Bureau, 2011a) with steady population increases expected until 2050 (see table 1.1). Moreover, the Census Bureau projects that the nation will become more diverse and the majority of the population will be concentrated in urban areas, continuing a trend that started in the late nineteenth century.
Table 1.1 Projections of the Population and Components of Change for the United States, 2015–2050
Source: US Census Bureau (2008a).
Race and Ethnicity
Census data project a continuing diversification of the US population in terms of race and ethnicity (see table 1.2). In fact, the Agency for Healthcare Research and Quality projects that members of underrepresented groups are expected to make up more than 40 percent of the US population by 2035 and 47 percent by 2050 (Brach & Fraser, 2000). The shifts in the ethnic and racial distribution and the age distribution of the US population denote an urgent need for health educators to develop culturally appropriate programs (Luquis & Pérez, 2005, 2006; Luquis, Pérez, & Young, 2006; Pérez, Gonzalez, & Pinzon-Pérez, 2006).
race
The categorization of parts of a population based on physical appearance due to particular historical social and political forces
ethnicity
Pertaining to or characteristic of a people, especially a group (ethnic group) sharing a common and distinctive culture, religion, language, or the like
Table 1.2 Projections of the Population by Sex, Race, and Hispanic Origin for the United States, 2015–2050 (in thousands)
Source: US Census Bureau (2008b).
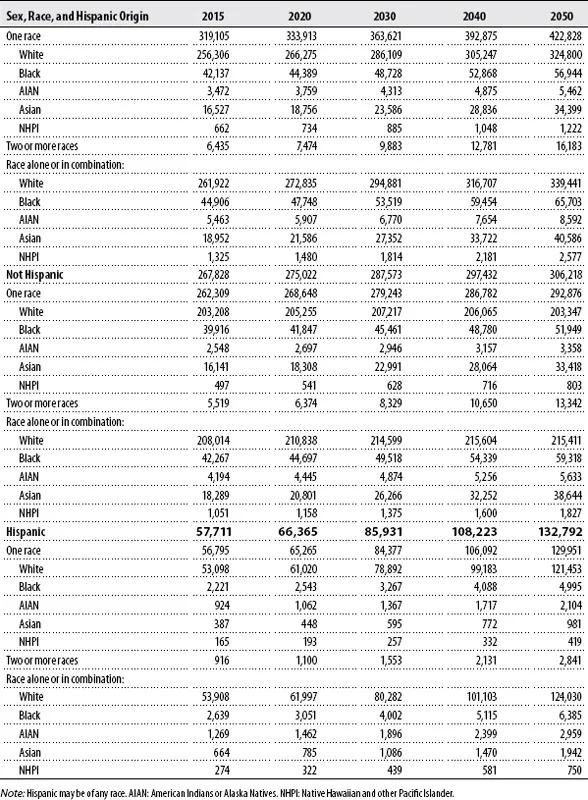
The 2000 Census marked a shift in how ethnic and racial data are collected. The Census Bureau introduced a larger pool of options, which allowed individuals to select more than one ethnic or racial background. Although controversial, this measure allows the identification of individuals of mixed descent.
Foreign Born and Immigrant
According to the American Community Survey Five-Year Estimates (2006–2010), 12.7 percent of the US population, or some 38,675,012 people, were foreign born; that is, they were residents who were not US citizens at birth (US Census Bureau, n.d.). This category includes legal permanent residents (immigrants), temporary migrants (such as students), humanitarian migrants (refugees), naturalized US citizens, and persons illegally present in the United States (US Census Bureau, 2006). The remainder of the US population was born in one of the fifty states (85.9 percent) or Puerto Rico (1.3 percent).
The American Community Survey Five-Year Estimates (2006–2010) show that the majority of the foreign-born population, excluding those born at sea, came from Latin America (see table 1.3).
Table 1.3 World Region of Birth of Foreign-Born Population in the United States, 2010
Source: US Census Bureau (n.d.).
| Estimate | Percent | |
| Europe | 4,847,078 | 12.5% |
| Asia | 10,747,229 | 27.8 |
| Africa | 1,466,454 | 3.8 |
| Oceania | 214,809 | 0.6 |
| Latin America | 20,565,108 | 53.2 |
| North America | 834,095 | 2.2 |
Approximately 72 percent of foreign-born individuals are legal immigrants, with over a third (37 percent) being naturalized citizens. It is estimated that some 8 million foreign-born individuals were unauthorized immigrants in 2010, marking a decrease from a peak of 8.4 million in 2007 (Hoefer, Rytina, & Baker, 2011; Passel & Cohn, 2011).
Language
Almost 80 percent of the US population 5 years and older speaks only English (US Census, n.d.). Of those who speak a language other than English at home, 8.7 percent report speaking it “less than well.” (See table 1.4 for a list of the major languages spoken in the United States.)
Table 1.4 Languages Spoken in the United States, 2010
Source: US Census Bureau (n.d.).
| Language | Percent |
| English | 79.9% |
| Spanish | 12.5 |
| Other Indo-European | 3.7 |
| Asian and Pacific Islander | 3.1 |
| Other | 0.8 |
California has the largest percentage of residents who speak a language at home other than English (40.8 percent), followed by New Mexico (36.0 percent) and Texas (32.5 percent) (US Census Bureau, n.d.).
The Elderly
The median age in the United States in 2010 was 37 years of age; however, the fastest-growing age group is those age 65 and older (table 1.5). In fact, demographers estimate that the number of individuals in this age category will more than double by the middle of this century (US Census Bureau, 1995, 2010b). (See table 1.5 for age distribution in the United States in 2010.)
Table 1.5 Projections of the Population by Selected Age Groups for the United States, 2015–2050
Source: US Census Bureau (2010b).
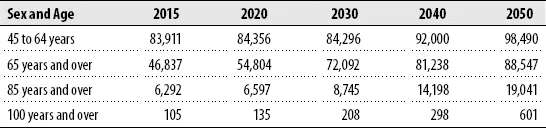
The elderly population is characterized by several factors, including more females than males (57 percent and 43 percent, respectively, in 2010). Not surprisingly, as the population shifts, the elderly population is also expected to become more racially and ethnically diverse. The proportion of elderly in each of the four major racial and ethnic groups—white, black, American Indian and Alaska Native, and Asian and Pacific Islander and in the Hispanic-origin population—is expected to increase substantially during the first half of this century.
Gender
In 2010, 50.8 percent of the US population were females and 49.2 percent were males. Similarly, in 2010, 85.9 percent of females and 84.6 percent of males had obtained a high school diploma, and 27.5 percent of females and 28.5 percent of males had obtained a baccalaureate degree (US Census, 2010b).
Sexual Orientation
...Table of contents
- Cover
- Contents
- Title
- Copyright
- Dedication
- Foreword
- Preface
- The Editors
- The Contributors
- Acknowledgments
- Chapter 1: Implications of Changing US Demographics for Health Educators
- Chapter 2: Diversity and Health Education
- Chapter 3: Health Disparities and Social Determinants of Health: Implications for Health Education
- Chapter 4: Complementary and Alternative Medicine in Culturally Competent Health Education
- Chapter 5: Spirituality and Cultural Diversity
- Chapter 6: Health Education Theoretical Models and Multicultural Populations
- Chapter 7: Planning, Implementing, and Evaluating Culturally Appropriate Programs
- Chapter 8: Culturally Appropriate Communication
- Chapter 9: Foundations for Health Literacy and Culturally Appropriate Health Education Programs
- Chapter 10: The Aging US Population
- Chapter 11: Culture and Sexual Orientation
- Chapter 12: Cultural Competency and Health Education
- Appendix A: Selected List of Web Resources for Health Disparities
- Appendix B: Summary of Selected Health Disparities
- Appendix C: Culturally and Linguistically Appropriate Services Standards
- Name Index
- Subject Index