![]()
Chapter 1
Knowledge Management for Action-Oriented Analytics
John S. Edwards and Eduardo Rodriguez
Contents
Introduction
Categorizing Analytics Projects
Classification by Technical Type
Classification from a Business Perspective
How Analytics Developed
Analytics, Operations Research/Management Science, and Business Intelligence
Overview of Analytics Examples
Single-Project Examples
Strategic Analytics
Managerial Analytics
Operational Analytics
Customer-Facing Analytics
Scientific Analytics
Multiple Project Examples
Future Developments
Organizational Environment
Political Environment
Analytics Workflow Embedded in Business Processes
Conclusion
References
Introduction
Analytics, Big Data, and especially their combination as “Big Data analytics” or “Big Data and analytics” (BDA) continue to be among the hottest current topics in applied information systems. With the exception of artificial intelligence methods such as those focused on deep learning, the emphasis on analytics is now moving away from the purely technical aspects to the strategic, managerial, and longer-term issues: not a moment too soon, some people would say.
In this chapter, we take a strategic perspective. How can an organization use analytics to help it operate more successfully? Or even to help it become the organization that those who run it would like it to be? The need for more thought about this is certainly evident, but the starting point is far from clear.
Our choice of starting point is to build on previous work on the relationship between analytics, Big Data, and knowledge management. This is represented as an action-oriented model connecting data, analytics techniques, knowledge, and patterns and insights. These elements will be used to categorize and analyze examples of analytics and big data projects, comparing the United Kingdom with other countries.
A particular focus is the difference between one-off projects, even if they lead to ongoing results, such as sensor monitoring, and ongoing activities or a series of projects. In the latter, our model adds influences of knowledge on data (what to collect and standardization of meaning), knowledge on techniques (new techniques developed in the light of past examples), and action on knowledge (learning from skilled practice).
Links will also be made to the higher-level issues that drive analytics efforts - or at least should do. These include the definition of problems, goals, and objectives, and the measurement of organizational and project performance. This raises the question of the relationship between knowledge management and strategic risk management.
Looking at the analytics “landscape,” we see that opinions, and even reported facts, differ fundamentally about the extent to which organizations are already using analytics. For example, several “white papers” attempt to describe the extent and nature of the use of analytics by employing variants of the well-known five-stage software engineering capability maturity model (CMM) (Paulk, Curtis, Chrissis, & Weber, 1993).
A report commissioned from the UK magazine Computing by Sopra Steria uses the same names as the CMM stages for respondents to describe their organization’s approach to data and analytics (Sopra Steria, 2016). The results were: initial 18%, repeatable 18%, defined 19%, managed 33%, and optimized 12%. International Data Corporation (IDC) has a very similar five-stage model for “BDA competency and maturity”—ad hoc, opportunistic, repeatable, manageable, and optimized—but their report gives no figures (Fearnley, 2015). MHR Analytics (MHR Analytics, 2017), a UK consultancy group focusing on human resource management, has developed a five-stage model for what they call the “data journey,” comprising the following: unaware 33%, opportunistic 7%, standards led 18%, enterprise 19%, and transformational 30%. However, the fact that these percentages add up to 107% does call their accuracy into question, even if only in the proofreading of the report. Nevertheless, the impression given from these three analyses is that at least half of the organizations responding are well on the way to making good use of analytics and Big Data.
On the more skeptical side, the American Productivity and Quality Center (APQC) reported in 2016 that four-fifths of organizations had not yet begun to take advantage of Big Data (Sims, 2016). This does seem to be closer to our own experience, although research by the McKinsey Global Institute (Henke et al., 2016) found considerable differences between sectors, with retail more advanced than most. As for the trend in Big Data and analytics use, again it may not be as rapid as some articles—usually, those not quoting data—imply. A report by the Economist Intelligence Unit (Moustakerski, 2015) suggests about a 10% movement toward the strategic use of data between 2011 and 2015.
One reason for this difference of opinion/fact is the type of decisions for which analytics and Big Data are being used. Are they the most significant decisions about the strategic direction of the business, characterized by the Economist Intelligence Unit in a report for PwC (Witchalls, 2014) as “big” decisions, or are they everyday decisions? Later in the chapter we will use a classification by Chambers and Dinsmore (2015) to help understand the effect of these differences.
The other crucial element is the extent to which the organization’s managers accept, and plan for the use of, analytics; indeed, it might not be an exaggeration to phrase that as the extent to which they believe in analytics. The Computing survey (Sopra Steria, 2016) found that only 25% of respondents’ organizations had a well-defined strategy and—not surprisingly in the light of that figure—that only 10% of analytics projects were “always” driven by business outcomes, with 44% being driven “most of the time.”
We see knowledge and its management as the connection between the organization and its strategy on the one hand, and the availability of data and the use of analytics on the other. It is well-recognized that organizations with a culture of knowledge sharing are more successful than those without such a culture (Argote, 2012). A key element in the use of BDA is the presence of a data-driven culture. A data-driven, or data-oriented, culture refers to “a pattern of behaviors and practices by a group of people who share a belief that having, understanding and using certain kinds of data and information plays a critical role in the success of their organization” (Kiron, Ferguson, and Prentice, 2013, p.18). This is the link to the “belief” in analytics that we mentioned earlier.
Nevertheless, belief by itself is not enough for effective use of analytics. A balance needs to be struck between the “having” and “using” elements of the definition, and the “understanding” element. Spender (2007) has found that there are three different types of understanding, although he prefers to call it organizational knowing. These are data, meaning, and skilled practice. To use the distinction identified by Polanyi (1966), some of this understanding and knowing is explicit (codifiable in language), and some is tacit (not readily expressible). Crucially, for skilled practice, the tacit knowledge dominates: even having good data and high-quality technical analysis is not enough on its own.
Another element in our thinking is that the development of the relationship between knowledge and analytics is in permanent evolution. Each time that an analytics solution is obtained, it is then time to start the search for a new analytics solution based on the knowledge acquired from the previous analytics solution implementation. Data changes, and that modifies the outcomes of the models, but at the same time the models are changing, the problems are better defined, and the scope is clearer, based on the experience in successive implementations. In addition, there is a clear challenge in using the freshest data that it is possible to access. In strategic risk, for example, every second the changes in the stock prices are potentially modifying some results in models; in credit risk, there is a need to use a permanent data flow that will potentially modify the outcomes for the decision-making process (granting loans).
When we consider analytics, meaning and skilled practice refer both to the analytics and to the target domain where the analytics techniques are being applied. Skilled practice and meaning also have a two-way relationship with knowledge; they influence it and they are influenced by it.
This two-way interaction of meaning and skilled practice is illustrated by the process of management control systems creation. In one direction the target domain is the development of systems to assure the implementation of strategy in organizations. The analytics domain concerns how to implement the knowledge from accounting, cost control, and so on to develop performance indicators and build up a measurement system for the organization’s performance at any level. Nucor Corporation (Anthony and Govindarajan, 2007) is an example where the organization started implementing knowledge management as a management control system, and evolved to develop capabilities to use data in its strategic development and strategy implementation and in particular to the use of business analytics (Hawley, 2016) for improving supply chain management practice, a core process in the business. Thus a better understanding of the requirements of management control systems led a transition from a general analytics view to specific analytics application in a key area of Nucor Corporation’s strategy.
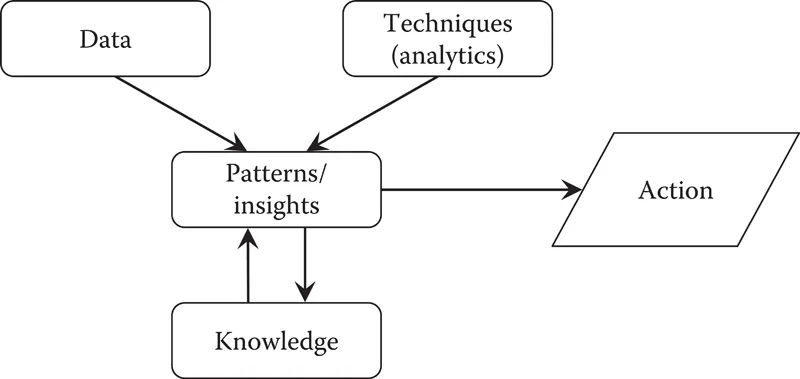
Figure 1.1 shows how knowledge, and the various elements involved in an analytics study, fit together when just a single study is considered. The knowledge falls into one or more of four categories:
Figure 1.1 The interactions between data, analytics, and human knowledge in a single study. (From Edwards, J.S., and Rodriguez, E., Proc. Comp. Sci., 99, 36–49, 2016.)
■ Knowledge about the domain, whether that is medical diagnosis, retail sales, bank customer loyalty, etc.
■ Knowledge about the data: are the sources reliable and accurate, are the meanings clear and well defined, etc.
■ Knowledge about the analytics techniques being used
■ Knowledge about taking action: how to make real change happen; this can be further subdivided into the aspects of people, processes, and technology (Edwards, 2009)
We see analytics acting to supplement gut feel and intuition in the development of solutions to business process problems. Knowledge management supports the development of actions in organizations looking to reduce the storage of knowledge that is never used. Knowledge that is not related to the process of finding solutions is not adding value to the organization. The same is true of data: data without analytics to create knowledge to be used in business solutions cannot provide value. The Economist Intelligence Unit/PwC report mentioned earlier (Witchalls, 2014) indicates that several factors in big decisions can affect the use of analytics. Analytics requires preparation time to create a process that adds value in the organization. Several decisions are made in a short time, forcing a decision based on reactions. The necessary preparation time to avoid reactive solutions or solutions and decisions enforced without good knowledge can be made available through a systematic analytics monitoring system and continuous feedback regarding decisions made and the value added by the analytics.
In the remainder of this chapter, we first offer some relevant definitions, then look at the history of analytics, and move into the related issue of terminology. This enables us to categorize the examples that we consider in the main body of the chapter. We then conclude by considering likely future influences of the political and business environments.
Categorizing Analytics Projects
There is still no generally agreed definition of analytics, although data and models feature in all those we have seen. For example, Davenport and Harris (2007, p.7) define analytics as “the extensive use of data, statistical and quantitative analysis, explanatory and predictive models, and fact-based management to drive decisions and actions.” By contrast, the Institute for Operations Research and the Management Sciences (INFORMS) explains that “analytics facilitates realization of business objectives through reporting of data to analyze trends, creating predictive models for forecasting and optimizing business processes for enhanced performance.” (Robinson, Levis, and Bennett, 2010).
We prefer those which are more action-oriented; that include a commitment to action, or an expectation of it, rather than just a hope, or even no mention of action at all, and so we use the Davenport and Harris definition.
Classification by Technical Type
Despite the lack of agreement on an overall definition, somewhat strangely there is a much broader agreement about the different types of analytics. By far the most commonly-seen is one that also comes (albeit rarely with proper credit) from the work commissioned from Cap Gemini by INFORMS (Robinson et al., 2010), which identifies three types: descriptive, predictive, and prescriptive analytics.
Descriptive analytics is “the use of data to figure out what happened in the past. Descriptive analytics prepares and analyzes historical data and identifies patterns from samples for reporting of trends” (Robinson et al., 2010). Specific techniques under this heading include data modeling, visualization and regression analysis, and newer techniques such as sentiment and affect analysis, web analytics, and graph mining. Subsequently, Gartner Research extended this taxonomy (Chandler, Hostmann, Rayner, & Herschel, 2011), restricting the category of descriptive analytics to the “what happened?” part, and separating that from the “why?”, which they called diagnostic analytics, but this distinction does not seem to have caught on more widely than in Gartner’s own materials.
Predictive analytics “uses data to find out what could happen in the future…Predictive analytics predicts future probabilities and trends and finds relationships in data not readily apparent with traditional analysis” (Robinson et al., 2010). Specific techniques here include predictive statistical modeling, the whole range of forecasting methods based on data, machine learning, and some forms of neural network analysis.
Prescriptive analytics “uses data to prescribe the best course of action to increase the chances of realizing the best outcome. Prescriptive analytics evaluates and determines new ways to operate, targets business objectives, and balances all constraints” (Robinson et al., 2010). Techniques such as optimization and simulation are in this group, along with others such as case-based reasoning, and neural networks that aim to recommend a particular course of action. Robinson et al. (2010) add that “Most of us would probably agree that in fact most operations research (OR) techniques reside in this space.”
Robinson et al. (2010) see the three types as a distinct hierarchy, commenting that “Businesses, as they strive to become more analytically mature, have indicated a goal to move up the analytics hierarchy to optimize their business or operational processes. They see the prescriptive use of analytics as a differentiating factor for their business that will allow them to break away from the competition.”...