1.2.1 Stress/strain relationships: the constitutive equation
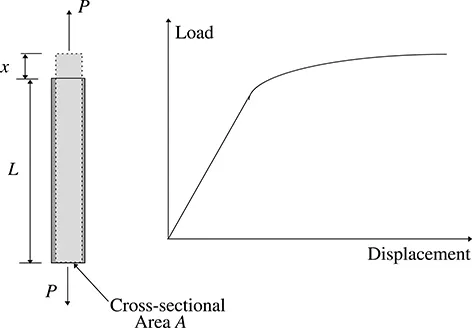
If we take a rod of some material and subject it to a load along its axis we expect that it will change in length. We might draw a load/displacement curve based on experimental data, as shown in figure 1.1.
We could construct a curve like this for any rod, but it is obvious that its shape depends on the geometry of the rod as much as on any properties of the material from which it is made. We could, however, chop the rod up into smaller elements and, apart from difficulties close to the ends, we might reasonably assume that each element of the same dimensions carries the same amount of load and extends by the same amount. We might then describe the displacement in terms of extension per unit length, which we will call strain (ε), and the load in terms of load per unit area, which we will call stress (σ). We can then redraw the load/displacement curve as a stress/strain curve, and this should be independent of the dimensions of the bar. In practice we might have to take some care in the design of a test specimen in order to eliminate end effects.
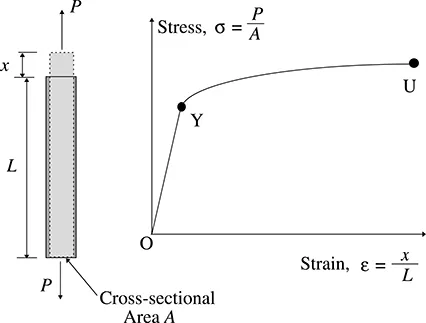
The shape of the stress/strain curve illustrated in figure 1.2 is typical of many engineering materials, and particularly of metals and alloys. In the context of biomechanics it is also characteristic of bone, which is studied in more detail in section 1.2.2. There is a linear portion between the origin O and the point Y. In this region the stress is proportional to the strain. The constant of proportionality, E, is called Young’s modulus,
Figure 1.1 Load/displacement curve: uniaxial tension.
Figure 1.2 Stress/strain curve: uniaxial tension.
σ = Eε.
The linearity of the equivalent portion of the load/displacement curve is known as Hooke’s law.
For many materials a bar loaded to any point on the portion OY of the stress/strain curve and then unloaded will return to its original unstressed length. It will follow the same line during unloading as it did during loading. This property of the material is known as elasticity. In this context it is not necessary for the curve to be linear: the important characteristic is the similarity of the loading and unloading processes. A material that exhibits this property and has a straight portion OY is referred to as linear elastic in this region. All other combinations of linear/nonlinear and elastic/inelastic are possible.
The linear relationship between stress and strain holds only up to the point Y. After this point the relationship is nonlinear, and often the slope of the curve drops off very quickly after this point. This meansthat the material starts to feel ‘soft’, and extends a great deal for little extra load. Typically the point Y represents a critical stress in the material. After this point the unloading curve will no longer be the same as the loading curve, and upon unloading from a point beyond Y the material will be seen to exhibit a permanent distortion. For this reason Y is often referred to as the yield point (and the stress there as the yield stress), although in principle there is no fundamental reason why the limit of proportionality should coincide with the limit of elasticity. The portion of the curve beyond the yield point is referred to as the plastic region.
The bar finally fractures at the point U. The stress there is referred to as the (uniaxial) ultimate tensile stress (UTS). Often the strain at the point U is very much greater than that at Y, whereas the ultimate tensile stress is only a little greater (perhaps by up to 50%) than the yield stress. Although the material does not actually fail at the yield stress, the bar has suffered a permanent strain and might be regarded as being damaged. Very few engineering structures are designed to operate normally above the yield stress, although they might well be designed to move into this region under extraordinary conditions. A good example of post-yield design is the ‘crumple zone’ of an automobile, designed to absorb the energy of a crash. The area under the load/displacement curve, or the volume integral of the area under the stress/strain curve, is a measure of the energy required to achieve a particular deformation. On inspection of the shape of the curve it is obvious that a great deal of energy can be absorbed in the plastic region.
Materials like rubber, when stretched to high strains, tend to follow very different loading and unloading curves. A typical example of a uniaxial test of a rubber specimen is illustrated in figure 1.3. This phenomenon ...