Understanding BIM presents the story of Building Information Modelling, an ever evolving and disruptive technology that has transformed the methodologies of the global construction industry. Written by the 2016 Prince Philip Gold Medal winner, Jonathan Ingram, it provides an in-depth understanding of BIM technologies, the business and organizational issues associated with its implementation, and the profound advantages its effective use can provide to a project team. Ingram, who pioneered the system heralding the BIM revolution, provides unrivalled access to case material and relevance to the current generation of BIM masters.
With hundreds of colour images and illustrations showing the breadth and power of BIM, the book covers:
The history of BIM
What BIM is in technical and practical terms
How it changes the day to day working environment
Why we need BIM and what problems it can solve
Where BIM is headed, particularly with regards to AI, AR, VR and voice recognition
International case studies from a range of disciplines including: architecture, construction management, and retail
Professionals and students in any field where the inter-disciplinary aspects of BIM are in operation will benefit from Ingram's insights. This book is an authoritative account of and reference on BIM for anyone wanting to understand its history, theory, application and potential future developments.
Häufig gestellte Fragen
Wie kann ich mein Abo kündigen?
Gehe einfach zum Kontobereich in den Einstellungen und klicke auf „Abo kündigen“ – ganz einfach. Nachdem du gekündigt hast, bleibt deine Mitgliedschaft für den verbleibenden Abozeitraum, den du bereits bezahlt hast, aktiv. Mehr Informationen hier.
(Wie) Kann ich Bücher herunterladen?
Derzeit stehen all unsere auf Mobilgeräte reagierenden ePub-Bücher zum Download über die App zur Verfügung. Die meisten unserer PDFs stehen ebenfalls zum Download bereit; wir arbeiten daran, auch die übrigen PDFs zum Download anzubieten, bei denen dies aktuell noch nicht möglich ist. Weitere Informationen hier.
Welcher Unterschied besteht bei den Preisen zwischen den Aboplänen?
Mit beiden Aboplänen erhältst du vollen Zugang zur Bibliothek und allen Funktionen von Perlego. Die einzigen Unterschiede bestehen im Preis und dem Abozeitraum: Mit dem Jahresabo sparst du auf 12 Monate gerechnet im Vergleich zum Monatsabo rund 30 %.
Was ist Perlego?
Wir sind ein Online-Abodienst für Lehrbücher, bei dem du für weniger als den Preis eines einzelnen Buches pro Monat Zugang zu einer ganzen Online-Bibliothek erhältst. Mit über 1 Million Büchern zu über 1.000 verschiedenen Themen haben wir bestimmt alles, was du brauchst! Weitere Informationen hier.
Unterstützt Perlego Text-zu-Sprache?
Achte auf das Symbol zum Vorlesen in deinem nächsten Buch, um zu sehen, ob du es dir auch anhören kannst. Bei diesem Tool wird dir Text laut vorgelesen, wobei der Text beim Vorlesen auch grafisch hervorgehoben wird. Du kannst das Vorlesen jederzeit anhalten, beschleunigen und verlangsamen. Weitere Informationen hier.
Ist Understanding BIM als Online-PDF/ePub verfügbar?
Ja, du hast Zugang zu Understanding BIM von Jonathan Ingram im PDF- und/oder ePub-Format sowie zu anderen beliebten Büchern aus Architecture & Architecture General. Aus unserem Katalog stehen dir über 1 Million Bücher zur Verfügung.
This appendix describes some of the tools developed by the Author to implement SONATA. A complete list of the tools that were written is included in Figure 225.
This information is included to give an insight as to the history, the issues and hopefully an understanding of the underpinnings of BIM.
Three-dimensional visualization is an important part of the design process for almost all structures. Visual impact, accessibility and even comprehension of the overall design is achieved through 3D images. It allows non-professionals to examine buildings, check lighting and shadows, each and all essential within the integrated model. The Author developed various algorithms over 20 years; almost all the images and hidden line drawings in this book are from this work. The Author extended the algorithms to include shadows, smooth shading, fog effects, transparency, textures and spotlights, and perhaps most importantly, to be efficient within computing constraints of the time. Many figures here show these effects.
The earlier images were produced with 1MHz processors, 0.1MB RAM. This constraint meant that considerable effort went into making the various parts of the algorithm efficient. The advent of GPUs and game engines have made the efficiency issues irrelevant but it is useful to know some of the processes involved in generating these images. We take for granted the live realistic scenes that appear in games and AR.
Systems produced a series of flat faces defined by a series of three-dimensional coordinates, with neither particular rhyme nor reason to the order of the faces. These faces must be rotated and projected onto a notional screen in front of the virtual viewer. Faces outside the view must be clipped away. The process then starts working out which bits of the faces (model) would be visible and which would not. For example, the objects on the other side of a solid wall are not visible. One has to know how far away every point on every surface is (for each pixel) and whether something is closer. The closest surface is drawn with a colour determined by the lights, shadows, surface type and orientation.
Hatching
Parametrics 2D/3D
Boolean 3D operations
Fonts definitions & plotting
Self-solving Networks
Closure detail cavity walls
2D shapes
Database structure
Clash detection
Snap Codes Line/Arc/Spline
User defined objects
3D shapes
Rendering algorithms
Language definition
Icons drawing
Hidden Line algorithms
Geometric Projections
Pull down menus
Spot Light
Clipping to Frustrum
Anti-aliasing
Fog
Box Geometry handling
Multiple project access **
Shadows
Flight path for videos
Icon file formats
Reverse Polish expression
Libraries of objects**
Plotting software
Drawings/Sheet handling
Wall Join Details
Polish Code executor
Bitmap generation
Window handling
Overall interface design
Figure 225. Tasks completed for SONATA 1997 (**after 1987)
Figure 226. 3D representation of eyeball movement following letters. 1975.1
This algorithm took an edge representation of plane facets, projecting data onto screen coordinates, and sorted the data with a bucket sort (a linear growth technique), one bucket per scan line. Scanning was from top to bottom of the scan line, maintaining an active edge and facet list. Edges were sorted using a bubble sort. The distance from the eye to each point on the facet was calculated and saved into a single dimensional array (an incremental calculation). Shading was calculated on a facet-by-facet basis and assigned colour values added to each visible pixel. This was called a single-dimensional Z-buffer. Even choosing the edge representations type, for which there were alternatives, involved guesswork. The lack of “core” memory (and it really was magnetic cores on wire thread) meant the algorithm had to be something more sophisticated than today’s frame buffers, certainly in terms of memory use. This algorithm was used by SONATA and REfLEX (possibly other well known CAD systems) to produce most of the images in this book.
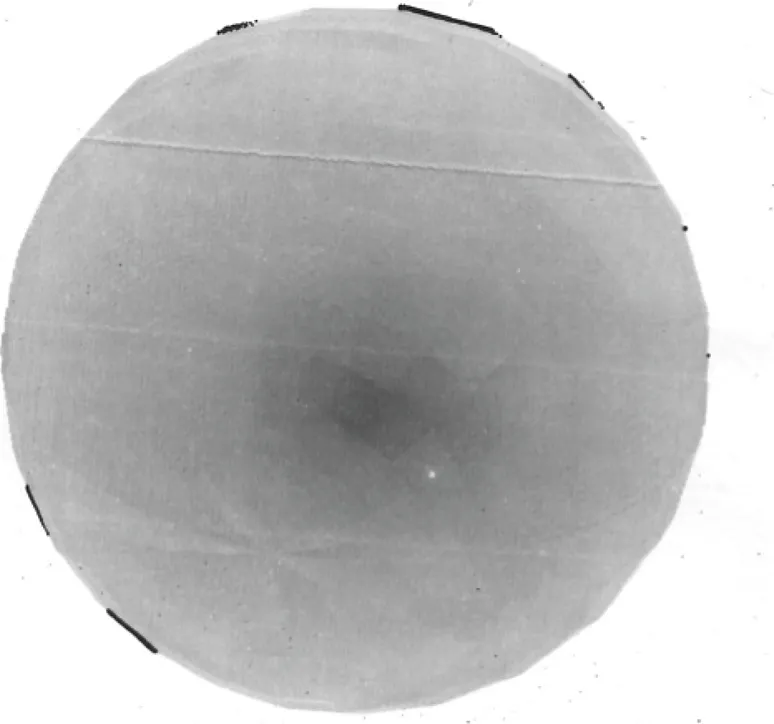
The images (Figure 230) of the ball and tori was on the cover of the Division of Computing Research magazine in November 1975 and is an example of the evolving one-dimensional Z-buffer algorithm. Cyan magenta yellow (CMYK) versions of the images had to be printed separately, to get the colour image. There were no colour monitors available at the time. Single-line Z-buffer techniques had become the main method for generating images. This technique used was again to “bucket sort” vertices in projection space and then scan from top to bottom of the “screen”. Edge lists were maintained with edge crossings (potential changes in the visibility of a line or edge) calculated exactly and stored. When edges existed, the current scan was processed and output: or not if they were not visible. This algorithm evolved over the years into something more accurate and faster. Floating-point calculations were counted to determine exact efficiency.
Using this technique made something like transparency easy; just another line of Z-buffer depths for the object behind the transparent object. The colour of the pixel is simply a summation of two-pixel colours, depending upon transparency and angle of the front face. Similarly, fog was relatively easy to simulate and allowed images to have a somewhat ethereal effect (see the images in the shadows chapter).
Textures, completed somewhat later in SONATA, are again straightforward if you ignore aliasing: however, where aliasing is ignored, the images were appalling! Something called summed texture maps won in the end, though that was never obvious. Generating shadows was complex, involving generating hidden-line views of the scene from the light source viewpoint, reconstructing the visible faces and adding them to the scene.
(see Figures 232 and 233). Internal scenes especially looked totally bland. To help add feeling to the images, the Author added spotlights. The user could define a colour, a range, and an intensity cone. The light intensity cone was defined by points to which a spline was fitted. This meany that a spot light could be defined with variable intensity away from the main direction of the light. There was a long-term bug that the light-cone would get a band in it that would not go away! See the bands in Figures 80, 81, 83 and 84.
It is often useful to be able to change colour within the finished images of particular objects. One can pick the colour on a particular object in a 3D rendered view and change all shades of the colour on the particular object within the view. Colour values were then changed for all instances of the component in the image by clicking on the buttons on the bottom of the screen. Figure 76 shows the office with colours changed. The buttons on the bottom of the screen allowed the selected object to change the colour via Red, Green and Blue, Hue Saturation and Intensity, and the Ambient Light.
Hidden line algorithms were always a challenge because of the large numbers of edges generated from full production drawings and the need for complete accuracy. “Pretty” 3D hidden line images were less critical in terms of construction implications than the drawings, so a variant on the hidden line algorithm used for the 1976 movie was used. In the end, it worked well, but there were numerous issues on the way. In some ways, the calculations were more complex than the rendering algorithms.