Data Analytics and Visualization in Quality Analysis using Tableau
eBook - ePub

Data Analytics and Visualization in Quality Analysis using Tableau

Jaejin Hwang, Youngjin Yoon

  1. 210 Seiten
  2. English
  3. ePUB (handyfreundlich)
  4. Über iOS und Android verfügbar
eBook - ePub

Data Analytics and Visualization in Quality Analysis using Tableau

Jaejin Hwang, Youngjin Yoon

Angaben zum Buch
Buchvorschau
Inhaltsverzeichnis
Quellenangaben

Über dieses Buch

Data Analytics and Visualization in Quality Analysis using Tableau goes beyond the existing quality statistical analysis. It helps quality practitioners perform effective quality control and analysis using Tableau, a user-friendly data analytics and visualization software. It begins with a basic introduction to quality analysis with Tableau including differentiating factors from other platforms. It is followed by a description of features and functions of quality analysis tools followed by step-by-step instructions on how to use Tableau. Further, quality analysis through Tableau based on open source data is explained based on five case studies. Lastly, it systematically describes the implementation of quality analysis through Tableau in an actual workplace via a dashboard example.

Features:


  • Describes a step-by-step method of Tableau to effectively apply data visualization techniques in quality analysis


  • Focuses on a visualization approach for practical quality analysis


  • Provides comprehensive coverage of quality analysis topics using state-of-the-art concepts and applications


  • Illustrates pragmatic implementation methodology and instructions applicable to real-world and business cases


  • Include examples of ready-to-use templates of customizable Tableau dashboards

This book is aimed at professionals, graduate students and senior undergraduate students in industrial systems and quality engineering, process engineering, systems engineering, quality control, quality assurance and quality analysis.

Häufig gestellte Fragen

Wie kann ich mein Abo kündigen?
Gehe einfach zum Kontobereich in den Einstellungen und klicke auf „Abo kündigen“ – ganz einfach. Nachdem du gekündigt hast, bleibt deine Mitgliedschaft für den verbleibenden Abozeitraum, den du bereits bezahlt hast, aktiv. Mehr Informationen hier.
(Wie) Kann ich Bücher herunterladen?
Derzeit stehen all unsere auf Mobilgeräte reagierenden ePub-Bücher zum Download über die App zur Verfügung. Die meisten unserer PDFs stehen ebenfalls zum Download bereit; wir arbeiten daran, auch die übrigen PDFs zum Download anzubieten, bei denen dies aktuell noch nicht möglich ist. Weitere Informationen hier.
Welcher Unterschied besteht bei den Preisen zwischen den Aboplänen?
Mit beiden Aboplänen erhältst du vollen Zugang zur Bibliothek und allen Funktionen von Perlego. Die einzigen Unterschiede bestehen im Preis und dem Abozeitraum: Mit dem Jahresabo sparst du auf 12 Monate gerechnet im Vergleich zum Monatsabo rund 30 %.
Was ist Perlego?
Wir sind ein Online-Abodienst für Lehrbücher, bei dem du für weniger als den Preis eines einzelnen Buches pro Monat Zugang zu einer ganzen Online-Bibliothek erhältst. Mit über 1 Million Büchern zu über 1.000 verschiedenen Themen haben wir bestimmt alles, was du brauchst! Weitere Informationen hier.
Unterstützt Perlego Text-zu-Sprache?
Achte auf das Symbol zum Vorlesen in deinem nächsten Buch, um zu sehen, ob du es dir auch anhören kannst. Bei diesem Tool wird dir Text laut vorgelesen, wobei der Text beim Vorlesen auch grafisch hervorgehoben wird. Du kannst das Vorlesen jederzeit anhalten, beschleunigen und verlangsamen. Weitere Informationen hier.
Ist Data Analytics and Visualization in Quality Analysis using Tableau als Online-PDF/ePub verfügbar?
Ja, du hast Zugang zu Data Analytics and Visualization in Quality Analysis using Tableau von Jaejin Hwang, Youngjin Yoon im PDF- und/oder ePub-Format sowie zu anderen beliebten Büchern aus Informatique & Infographie. Aus unserem Katalog stehen dir über 1 Million Bücher zur Verfügung.

Information

Verlag
CRC Press
Jahr
2021
ISBN
9781000413656
Auflage
1

1 Introduction

Chapter Overview and Expected Learning Outcomes

In this chapter, we will introduce the basic concepts of quality and quality management including quality planning, quality assurance, quality control, and quality improvement. Especially, DMAIC (Define, Measure, Analyze, Improve, and Control) approach will be described as a quality improvement strategy. The potential benefit of quality analysis will be discussed as well.
We will introduce the data visualization tool, Tableau, in this chapter. Several features and strengths of Tableau will be described. More importantly, the potential benefit of Tableau’s application to quality areas will be discussed.
After studying this chapter, expected learning outcomes are:
  1. Explain the concept of quality.
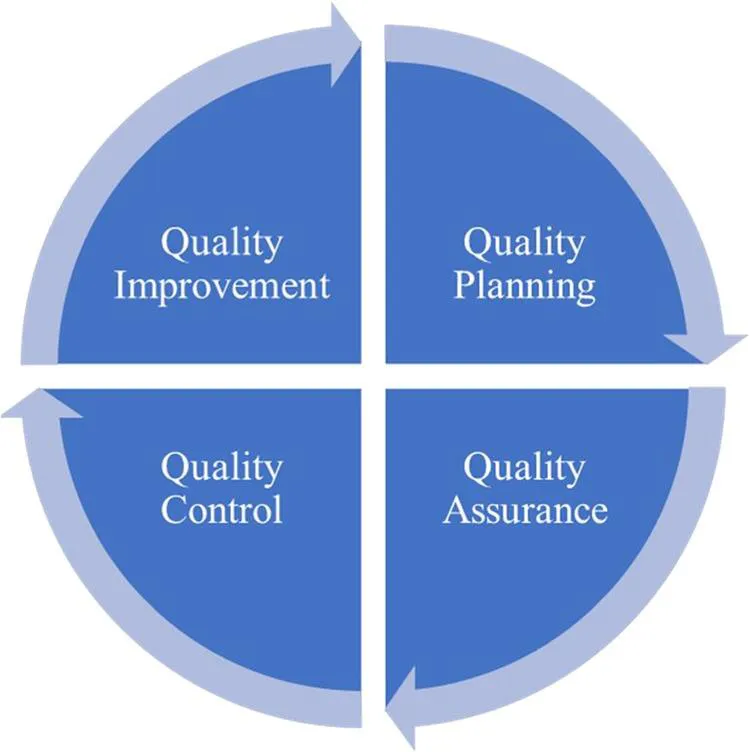
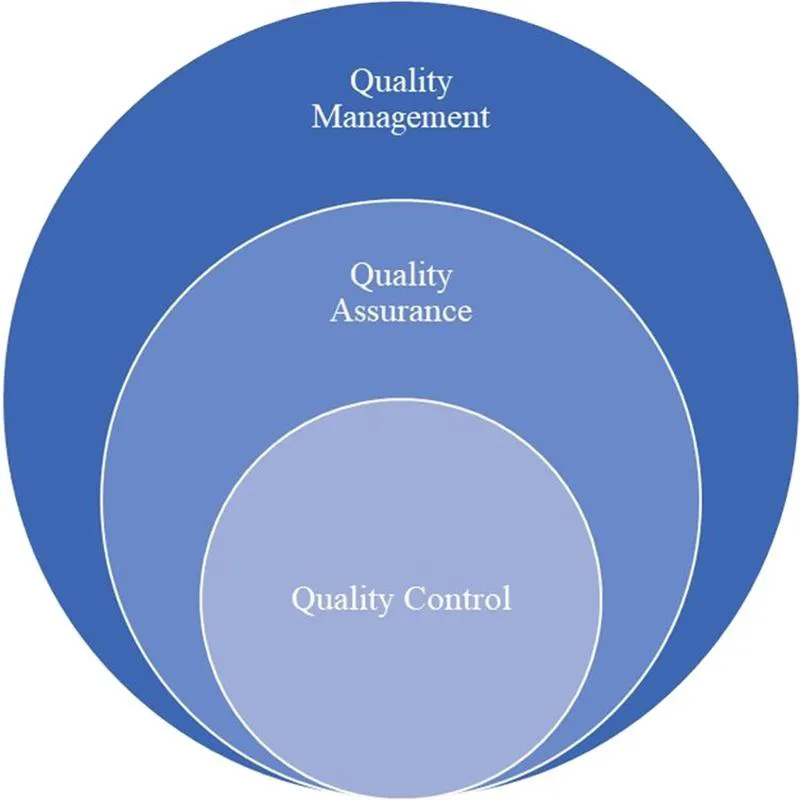
  2. Explain the concept of quality management and related four major items.
  3. Know the overall flow of the DMAIC approach.
  4. Understand the basic features and strength of Tableau.
  5. Explain how Tableau can leverage quality analysis.

1.1 Basic Concepts in Quality Analysis

What is quality? By definition of the American Society of Quality (ASQ), quality has two meanings: (1) maintaining the level of a product or service to meet expectations (of customers), and (2) a product or service that is free from defects. In other words, the concept of quality can be applied very broadly to our modern society, including manufacturing, healthcare, construction, and service industries.
When approaching quality from a macroscopic perspective, it is important to understand quality management. What is quality management? It means putting quality as the top priority in management. It is a company-wide, comprehensive management system that requires the participation of all members throughout management activities. The quality policy is applied to all activities in management to meet the desired level of customer satisfaction.
Quality management consists of four major items: (1) quality planning, (2) quality assurance, (3) quality control, and (4) quality improvement.
Quality planning determines an effective and comprehensive plan for quality based on documentation of quality standards, practices, resources, specifications, schedule, and framework. It gives an overall direction of what to do.
Quality assurance refers to all planned and systematic activities carried out in the quality system to give an appropriate sense of confidence that the product or service meets quality requirements.
Quality control refers to operational techniques and activities used to meet quality requirements. Quality control can be considered as a sub-concept of quality assurance. Quality assurance is an activity that places a lot of weight on the customer’s point of view and taking more comprehensive responsibility for the product. On the other hand, quality control puts a lot of weight on the product and verifies the function according to the specifications of the product (Figure 1.1).
Figure 1.1 Quality management, quality assurance, and quality control relationships.
Quality improvement focuses on improving the performance of products or services. The PDSA (plan-do-study-act) cycles are commonly used approaches. In these PDSA cycles, quality personnel try and test new improvement methods through iterative cycles until they feel confident of implementing them for the desired results. PDSA is also called the Deming Cycle. Dr. W. Edward Deming is known as the “father” of the field of quality management. The core of PDSA is that when improving quality problems, it is necessary to pay attention to the overall system and process with a long-term perspective rather than urgently taking care of the problems in front. Deming emphasized that the quality problem is not a fault of field workers, but rather a problem of the part of the manager’s responsibility or the entire system.
For quality improvement, the Define, Measure, Analyze, Improve, and Control (DMAIC) is another well-known quality strategy to improve the entire process. As the name stated, this strategy consists of five phases. This strategy could be widely applied to any standard quality improvement procedure. Figure 1.2 shows the flow chart of the DMAIC methodology (Ansar et al., 2018).
The flow chart of the DMAIC methodology is given. First, define the problem to be solved and then measure the related data of quality characteristics. After that, analyze the data collected and determine if the modification of the design is necessary. If yes, the redesign is conducted, and flow goes back to the Measure stage. If no, improvement suggestions could be produced. Finally, the process could be monitored and controlled to maintain the desired quality levels.
Figure 1.2 The flow chart of the DMAIC methodology.
  • Define
    In this stage, the problem of the process is defined, and the related project scope is determined. The project goals and customers’ expectations are clearly defined. This stage is important to determine the overall direction of the project. To better define the project, the voice of the customer and value stream map could be considered to understand the customers’ expectations and the overall flow of the entire process.
  • Measure
    This stage directly measures the performance of the process. Process map (i.e., flow chart) can be used to document each operation (i.e., activity) under the process. Process capability analysis can be considered to assess whether the inherent variability of the process meets the specification limits which are externally determined. The Pareto chart is another useful tool to extract a few significant vital factors affecting the overall quality of the process.
  • Analyze
    This stage analyses the process to find out the root causes of the low performance of the process. The root cause analysis (e.g., cause-and-effect diagram) could be considered to brainstorm and summarize potential causes of the quality issues. The Failure Model and Effects Analysis (FMES) could be useful to identify and prioritize the potential failures (e.g., defects) of the process based on the severity, expected frequency, and the probability of detection. The multi-vari chart is another useful tool to assess the variation of multiple operations in the process. After analyzing various methods, it could be determined whether the redesign of the process is necessary. If the modification of the design is necessary, it can go back to the Measure stage to evaluate the quality characteristics of the redesigned process. If there is no need for the modification, it can move forward to the next step, Improve.
  • Improve
    This stage addresses the assignable causes of the issues to improve the quality of the process. The design of experiment methodology could be considered to identify key factors critically affecting the quality or performance of the process. Once major factors are identified, improvement efforts could be prioritized on these factors.
  • Control
    Once the process is improved by eliminating the issues, this stage controls and maintains the improved performance of the process. A quality control plan could be initially designed and documented to consider several quality-related resources such as quality standards, practices, specifications, and contracts. After that, statistical process control charts could be used to monitor the quality characteristics of the process. This approach helps to identify unusual events such as very high or low process variation. The five S (5S: sort, set in order, shine, standardize, sustain) could also help to organize the workplace and better control the process.
    Within the quality management system, the above-mentioned factors should be improved and evolved in a continuous improvement cycle, as seen in Figure 1.3. Jack Welch of General Electric (GE) firmly believed that quality control could be the critical factor in making companies most competitive and meeting customer satisfaction. Jack Welch operated the ‘Six Sigma’ program and performed the DMAIC steps. All GE employees have been involved in this process, and this program substantially reduced the defective rate of the products. Because of his rigorous quality management system, in the 20 years of his tenure as CEO, sales have increased fivefold. Quality management levels may differ depending on the degree of practice or implementation method, the interest of top management, corporate size, and culture, but in general, the following effects can be expected through quality management.
  • Cost reduction
    The quality analysis helps to identify the waste in the process. The reduction of waste directly affects the cost reduction in the product development stage. Increased quality of the product also reduces the occurrences of repairs, which lowers the cost of fixing the product.
  • Improved brand reputation
    If customers experience a good quality of the product or service, they trust more about the company. Customers could feel more favorable about purchasing the items from the company.
  • Better customer experience
    The quality analysis helps to determine the critical factors affecting the customers’ experience and satisfaction. This information is useful to improve the system and the end product to meet customers’ expectations.
  • Increased revenue
    The aforementioned cost reduction due to the quality analysis is directly related to increased revenue. Increased sales because of the good quality of products could lead to greater revenue.
The quality management cycle consists of quality planning, quality assurance, quality control, and quality improvement. The iterative cycle is conducted to keep improving and maintaining the quality.
Figure 1.3 Quality management cycle.

1.2 What Is Tableau?

Looking at the background behind the Tableau company’s founders, the core goal of the software can be understood more clearly. Tableau is a company founded by three Stanford University graduates Christian, Chris, and Pat. They were working on a data analysis project in 1999, and they had a hard time running the program using Business intelligence (BI) software commonly used in the market. Even those who majored in subjects related to computers had difficulty operating BI software. They realized the need for improvement in BI software. Through this, the Tableau Company was founded in 2003, and the main management philosophy is “Helping people see and understand data.” In other words, Tableau is a leading analytics platform company that allows anyone, regardless of skill level, to use and work with data.
Tableau Software is one of the fastest-growing data visualization tools which helps people to view and understand the characteristics of data. It involves intuitive and spontaneous user interface technologies such as dragging and dropping interactions, which makes it easy for users to learn and use the tool. Interactive visualizations, including graphs, dashboards, maps, and tables, encourage users to build their customized visualization reports.
Any type and size of data can be connected, analyzed, and visualized through Tableau. We can interpret and understand the results by collecting, storing, and analyzing data through Tableau. Based on the results of the analysis, we can come up with the processes and methods that optimize the desired outcomes in studies or business. In other words, it aims to use data to make the best decisions and, as a result, to get an optimal solution to achieve the desired goal.
In the past, gathering, connecting, analyzing, and understanding data was not a simple task. It required a high level of technical knowledge such as Structured Query Language, Relational Database, Statistics, and so on. Therefore, since collaboration with the IT department or data experts was essential in order to utilize the data, there was a clear limit to the slow processing speed or the accuracy of data interpretation.
With the advent of the data visualization tool, Tableau, users minimize their dependence on the IT department or data experts when analyzing data and it helps users analyze, interpret, and understand the data themselves. Through this, end users can gather, connect, analyze, and understand data and discover insights through constant repetition of questions and answers to achieve goals.
As a result, Tableau helps organizations or individuals use data in the area of ​​self-service analysis, where they see and understand data by themselves. Currently, Tableau is a trusted leader in data analytics, helping people and organizations to make more data-driven decisions.
In this book, the Tableau Desktop version will be used for all examples. Tableau Desktop provides an environment where we can directly connect and analyze data sources stored on-premises or in the cloud. Users can view and understand data with just drag, drop, and double click. Furthermore, it provides an environment in which data can be viewed interactively through a dashboard. Advanced analysis is also possible by using additional functions such as various calculation functions, line addition, and data clustering. If necessary, Tableau Server/Online or Tableau Prep provided by Tableau can be used to take advantage of additional features.
Tableau offers a 14-day free trial to anyone interested in Tableau. (https://www.tableau.com/products/trial). If the user is a student or faculty member of an accredited educational institution, it can be used for free with a one-year free license for Academic (renewable for enrolled students). Download Tableau through the following link (https://www.tableau.com/academic) and upload your ...

Inhaltsverzeichnis