Salesforce Lightning Reporting and Dashboards
Johan Yu
- 402 Seiten
- English
- ePUB (handyfreundlich)
- Über iOS und Android verfügbar
Salesforce Lightning Reporting and Dashboards
Johan Yu
Über dieses Buch
Learn how to build advanced reports and dashboards in Salesforce Lightning experienceAbout This Book• Visualize and create advanced reports and dashboards using Lightning Experience• Improve overall business efficiency with advanced and effective reports and dashboards• Understand and create custom reports and dashboardsWho This Book Is ForThis book is targeted at Salesforce.com administrators, business analysts, and managers who use Salesforce.com for their daily job and want to learn in depth about Salesforce Reporting and Dashboard in Lightning Experience. Readers should have a basic knowledge of Salesforce, such as: Accounts, Contacts, Leads, Opportunities and custom objects.What You Will Learn• Navigate in Salesforce.com within the Lightning Experience user interface• Secure and share your reports and dashboards with other users• Create, manage, and maintain reports using Report Builder• Learn how the report type can affect the report generated• Explore the report and dashboard folder and the sharing model• Create reports with multiple formats and custom report types• Explore various dashboard features in Lightning Experience• Use Salesforce1, including accessing reports and dashboardsIn DetailBuilt on the Salesforce App Cloud, the new Lightning Experience combines the new Lightning Design System, Lightning App Builder, and Lightning Components to enable anyone to quickly and easily create modern enterprise apps.The book will start with a gentle introduction to the basics of Salesforce reports and dashboards. It will also explain how to access reports in depth. Then you will learn how to create and manage reports, to use Schedule Report, and create advanced report configurations. The next section talks about dashboards and will enable you to understand and compare various types of dashboard component and how you can benefit the most from each of them. Then we move on to advanced topics and explain tips and tricks related to reports and dashboards, including reporting snapshots, report parameters, and collaboration.Finally, we will discuss how to access dashboards and reports from the Salesforce1 mobile app.Style and approachThis comprehensive guide covers the advanced features of the all new Salesforce Lightning concepts and communicates them through a practical approach to explore the underlying concepts of how, when, and why to use them.
Häufig gestellte Fragen
Information
Creating and Managing Reports
- Selecting the report format
- Adding report filters
Selecting the report format
Types of report format
- Tabular
- Summary
- Matrix
- Joined
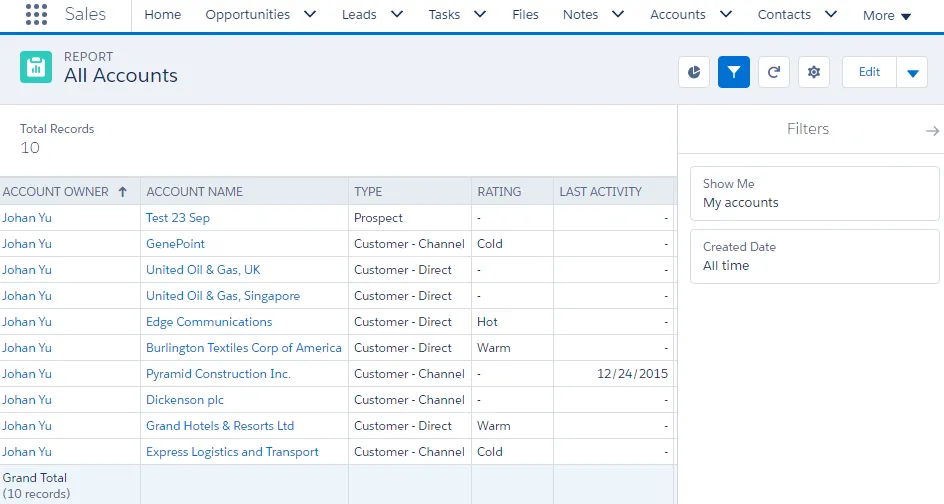
The Tabular report format
- No grouping
- No chart
- Not used as the data source for a dashboard unless the Row Limit filter is configured
- The report builder preview shows a maximum of 50 rows.
- Reports display a maximum of 2,000 rows. To view all the rows, export the report to Excel.