Learning Tableau 2019
Tools for Business Intelligence, data prep, and visual analytics, 3rd Edition
Joshua N. Milligan
- 504 Seiten
- English
- ePUB (handyfreundlich)
- Über iOS und Android verfügbar
Learning Tableau 2019
Tools for Business Intelligence, data prep, and visual analytics, 3rd Edition
Joshua N. Milligan
Über dieses Buch
Create powerful data visualizations and unlock intelligent business insights with Tableau
Key Features
- Explore all the latest Tableau 2019 features and redefine business analytics for your organization
- Create impressive data visualizations and interactive dashboards to get insights from your data
- Learn effective data storytelling to transform how your business leverages data and makes decisions
Book Description
Tableau is the gold standard of business intelligence and visual analytics tools in every industry. It enables rapid data visualization and interpretation with charts, graphs, dashboards, and much more. Updated with the latest features of Tableau, this book takes you from the foundations of the Tableau 2019 paradigm through to advanced topics.
This third edition of the bestselling guide by Tableau Zen Master, Joshua Milligan, will help you come to grips with updated features, such as set actions and transparent views. Beginning with installation, you'll create your first visualizations with Tableau and then explore practical examples and advanced techniques. You'll create bar charts, tree maps, scatterplots, time series, and a variety of other visualizations. Next, you'll discover techniques to overcome challenges presented by data structure and quality and engage in effective data storytelling and decision making with business critical information. Finally, you'll be introduced to Tableau Prep, and learn how to use it to integrate and shape data for analysis.
By the end of this book, you will be equipped to leverage the powerful features of Tableau 2019 for decision making.
What you will learn
- Develop stunning visualizations that explain complexity with clarity
- Explore the exciting new features of Tableau Desktop and Tableau Prep
- Connect to various data sources to bring all your data together
- Uncover techniques to prep and structure your data for easy analysis
- Create and use calculations to solve problems and enrich analytics
- Master advanced topics such as sets, LOD calcs, and much more
- Enable smart decisions with clustering, distribution, and forecasting
- Share your data stories to build a culture of trust and action
Who this book is for
This Tableau book is for anyone who wants to understand data. If you're new to Tableau, don't worry. This book builds on the foundations to help you understand how Tableau really works and then builds on that knowledge with practical examples before moving on to advanced techniques. Working experience with databases will be useful but is not necessary to get the most out of this book.
Häufig gestellte Fragen
Information
Section 1: Tableau Foundations
- Chapter 1, Taking Off with Tableau
- Chapter 2, Working with Data in Tableau
- Chapter 3, Venturing on to Advanced Visualizations
Taking Off with Tableau
- The cycle of analytics
- Connecting to data
- Foundations for building visualizations
- Creating bar charts
- Creating line charts
- Creating geographic visualizations
- Using Show Me
- Bringing everything together via a dashboard
The cycle of analytics
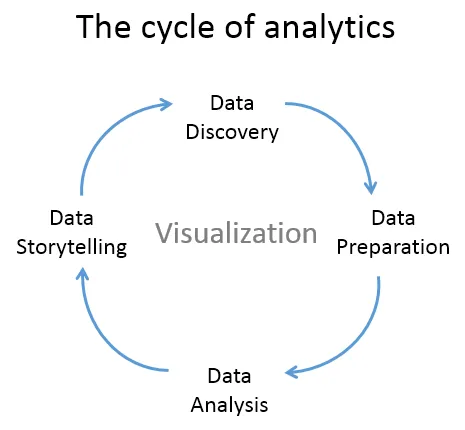
- Data discovery: You can very easily explore a dataset using Tableau and begin to understand what data you have visually.
- Data preparation: Tableau allows you to connect to data from many different sources and, if necessary, create a structure that works best for your analysis. Most of the time, this is as easy as pointing Tableau to a database or opening a file, but Tableau gives you the tools to bring together even complex and messy data from multiple sources.
- Data analysis: Tableau makes it easy to visualize the data, so you can see and understand trends, outliers, and relationships. In addition to this, Tableau has an ever-growing set of analytical functions that allow you dive deep into understanding complex relationships, patterns, and correlations in the data.
- Data storytelling: Tableau allows you to build fully interactive dashboards and stories with your visualizations and insights so that you can share the data story with others.
Connecting to data
- Open Tableau. You should see the home screen with a list of connection options on the left and, if applicable, thumbnail previews of recently edited workbooks in the center, along with sample workbooks at the bottom.
- Under Connect and To a File, click Text File.
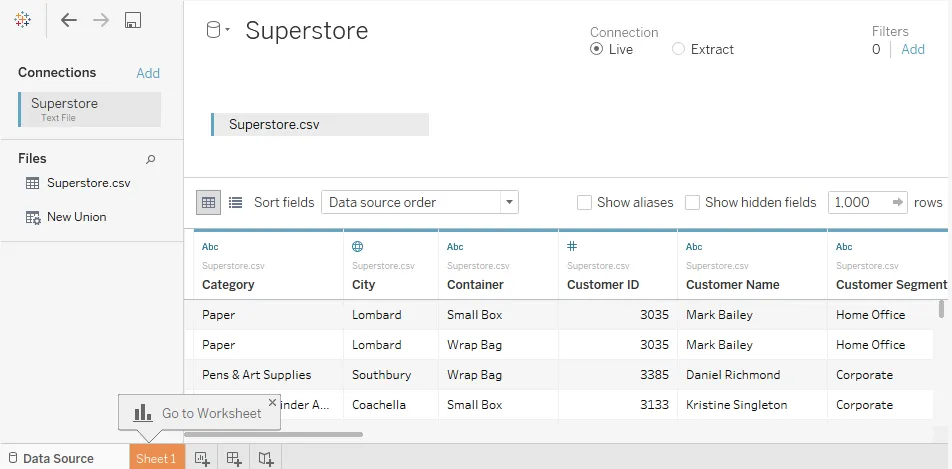
- In the Open dialogue box, navigate to the \Learning Tableau\Chapter 01 directory and select the Superstore.csv file.
- You will now see the data connection screen, which allows you to visually create connections to data sources. We'll examine the features of this screen in detail in the Connecting to data section of Chapter 2, Working with Data in Tableau. For now, Tableau has already added and given a preview of the file for the connection:

- The Menu contains various menu items for performing a wide range of functions.
- The Toolbar allows for common functions such as undo, redo, save, add a data source, and so on.
- The Side Bar contains tabs for Data and Analytics. When the Data tab is active, we'll refer to the side bar as the data pane. When the Analytics tab is active, we'll refer to the side bar as the analytics pane. We'll go into detail later in this chapter, but for now, note that the data pane shows the data sour...